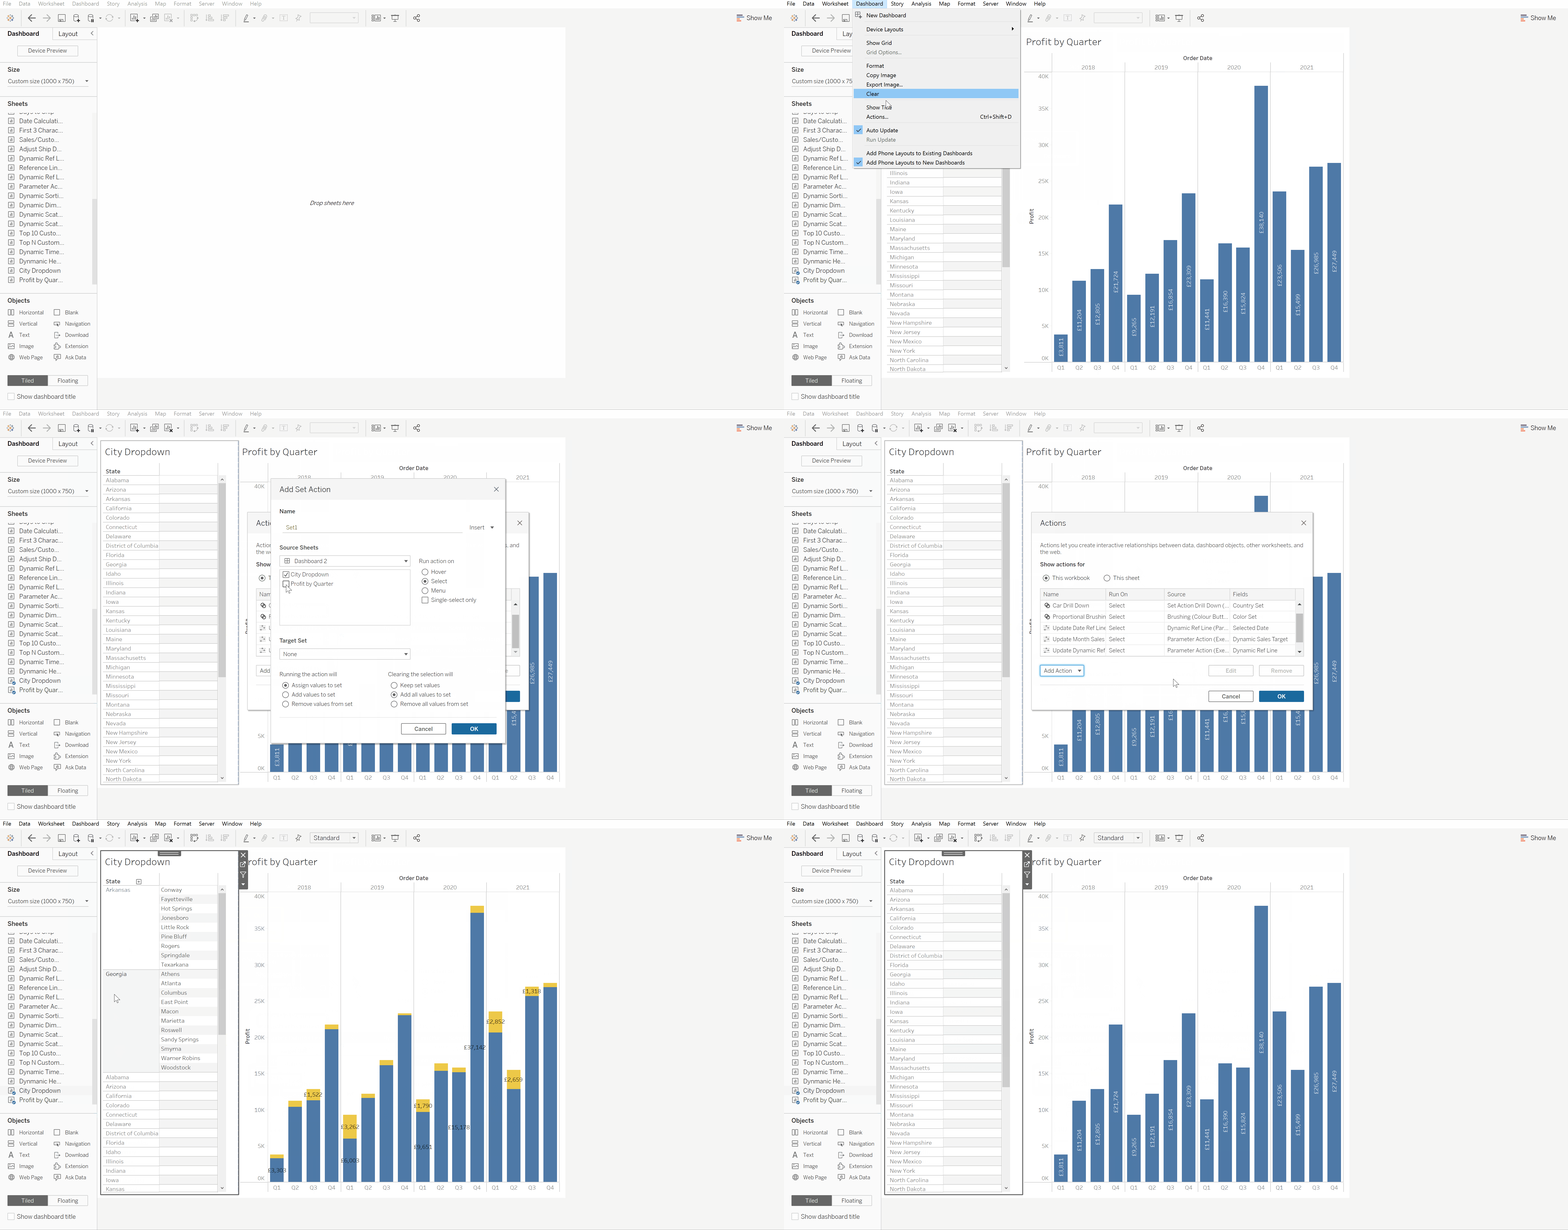
I knew nothing about Set Action until I submitted my second dashboard to The Information Lab's application but I have to admit that I did things at the time by referring others' work without understanding what was going on. Only today, after my second day of the second week of training, I can proclaim: "I finally get the hang of Set Action in Tableau!"
Suppose we want to get an idea of the proportion in which certain states contribute to total profits in each quarter, and we want to know which cities are in that particular state. We can have the following two charts:
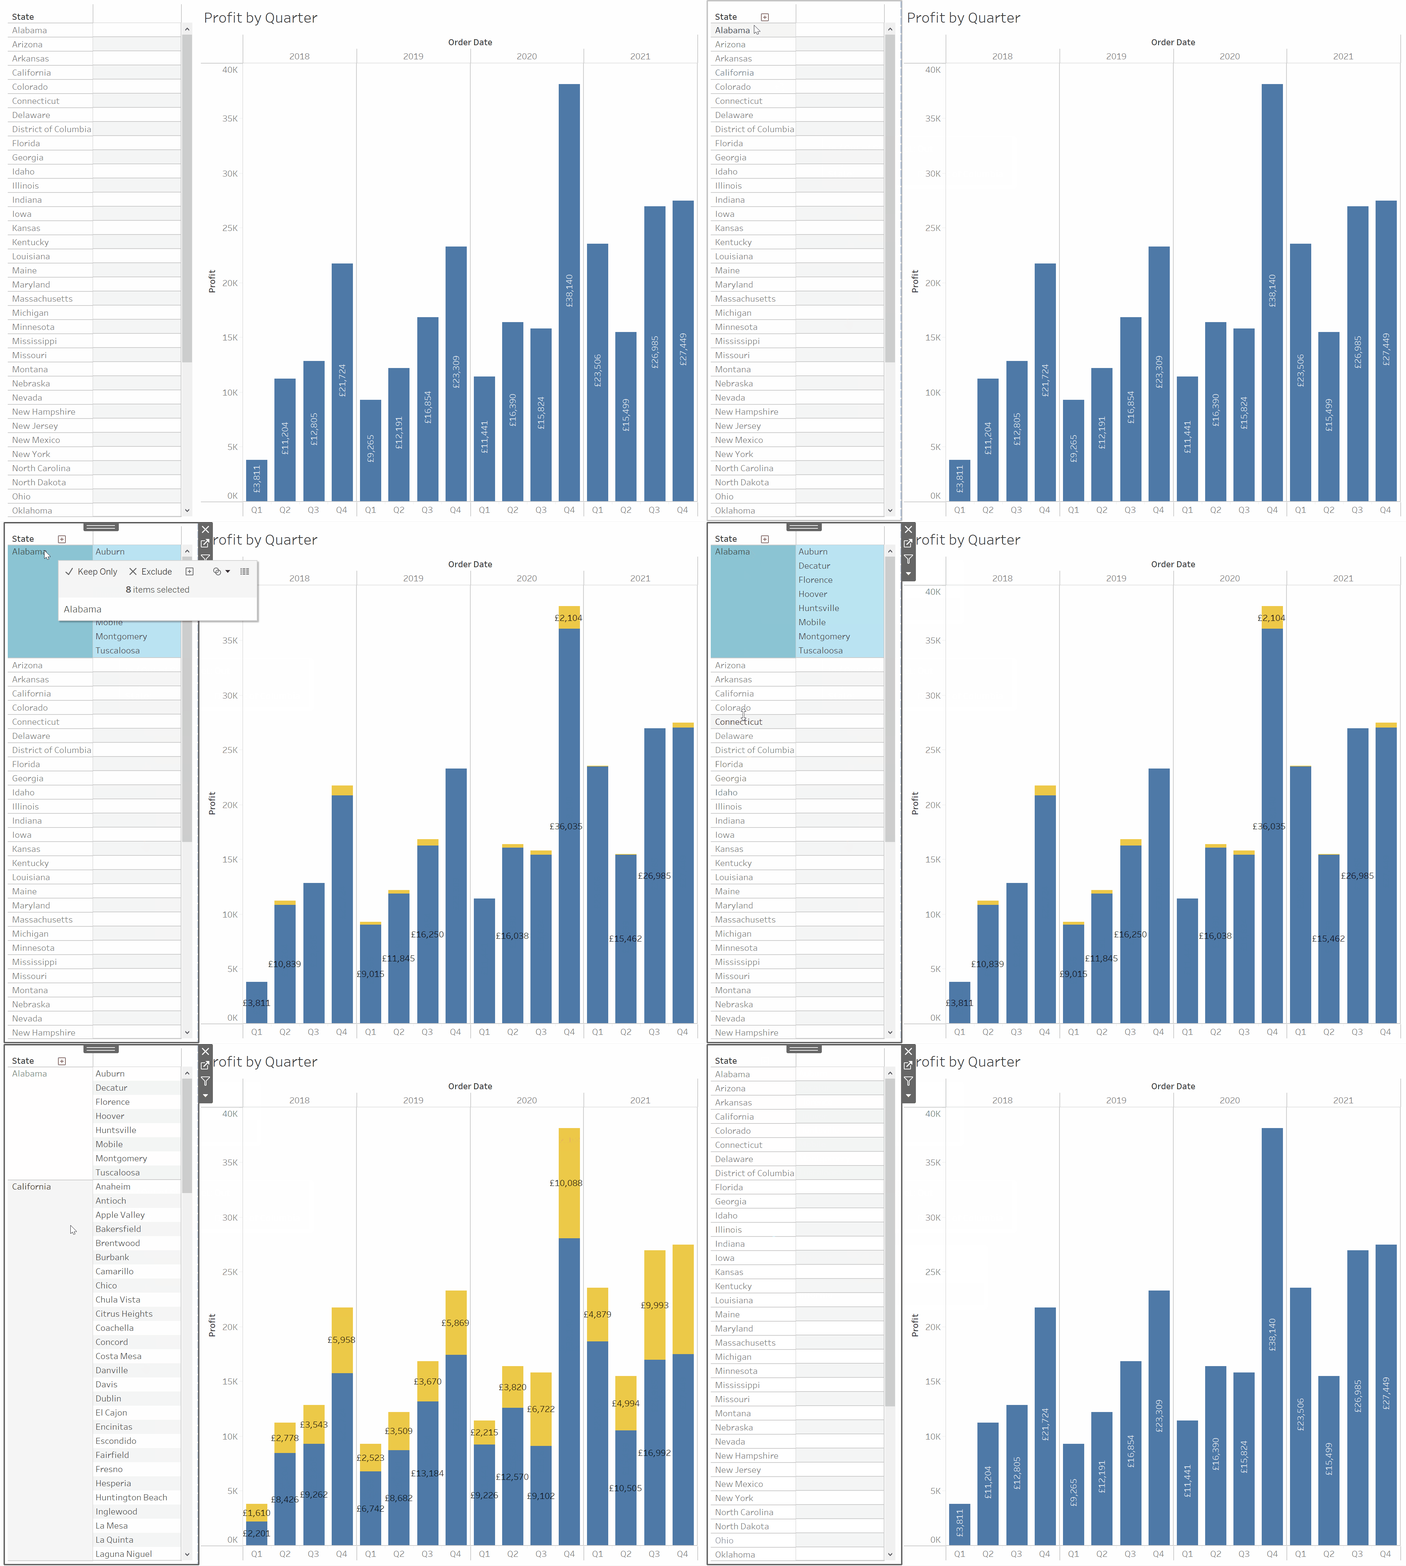
PART 1: How to create a Drill Down Table?
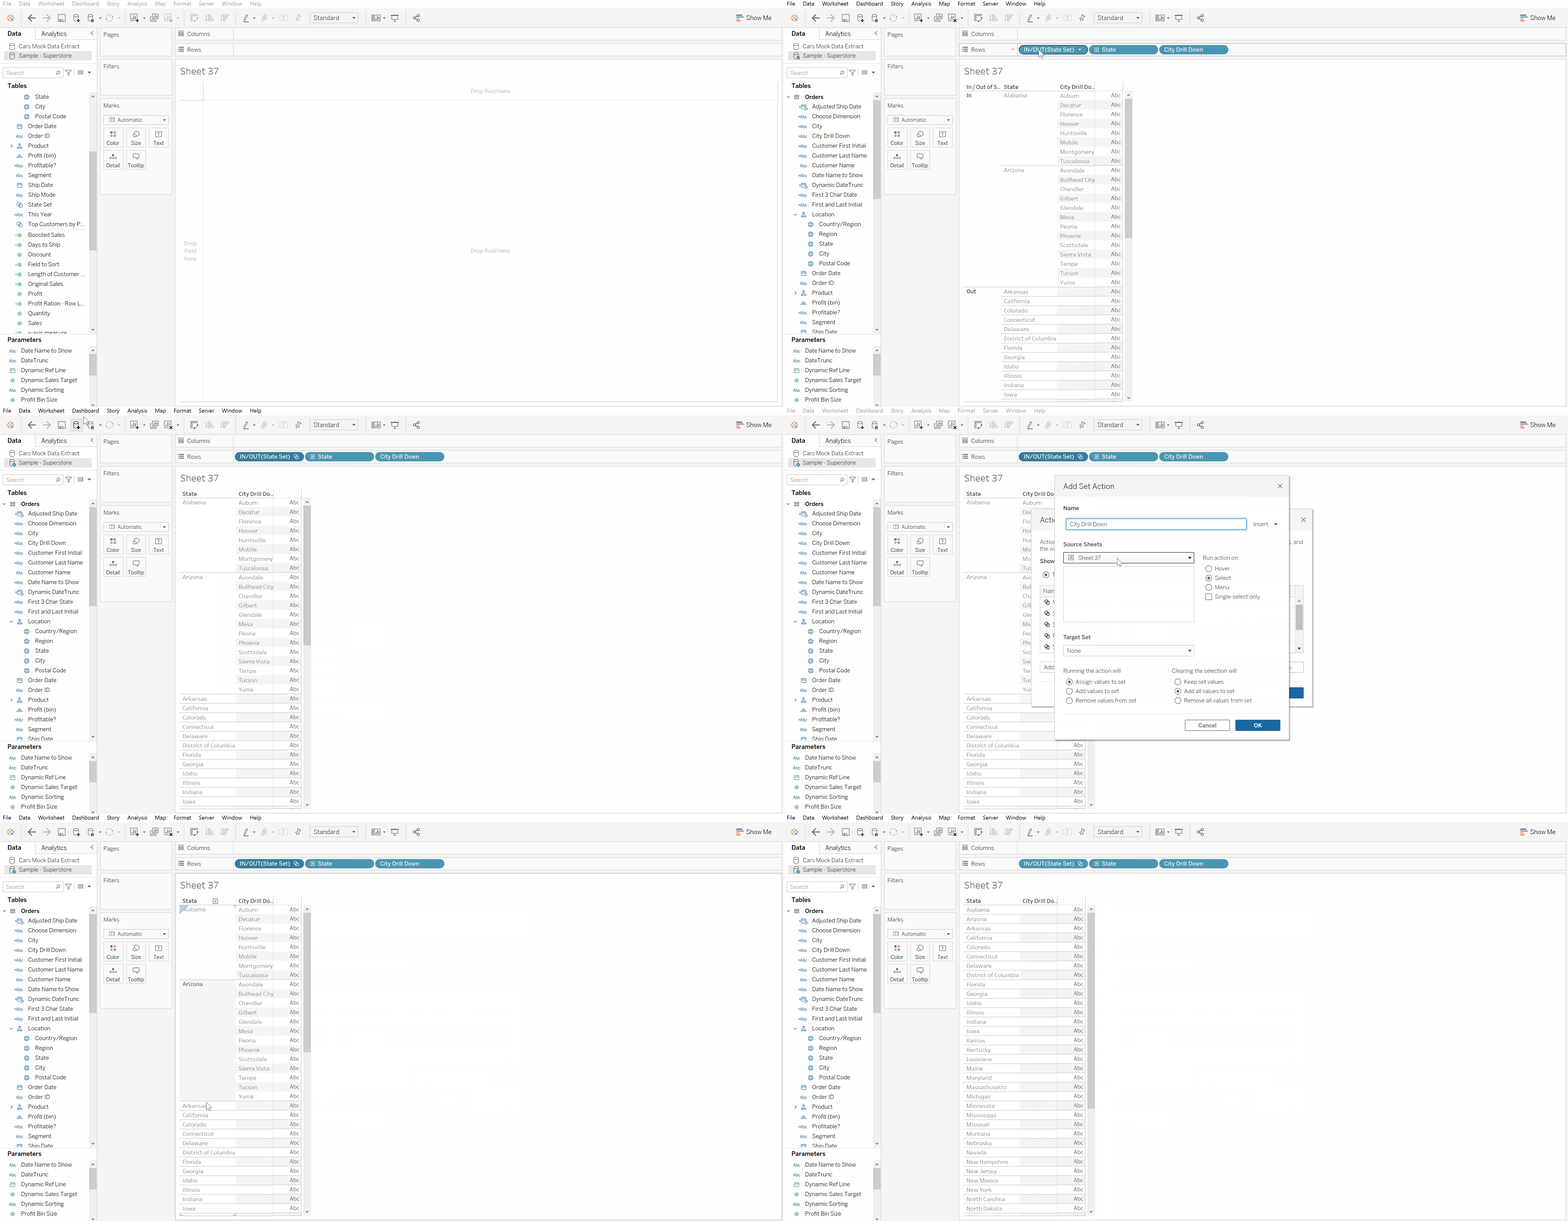
A drill down table is used to display a field when another field is selected/clicked by the user. To accomplish this in Tableau, we need to create 3 things: a set for the user to assign value to it when he/she click the field to be selected, a modified field for the display (created with a calculated field), and a set action to change the value assigned to the set when the user clicks on the field to be selected.
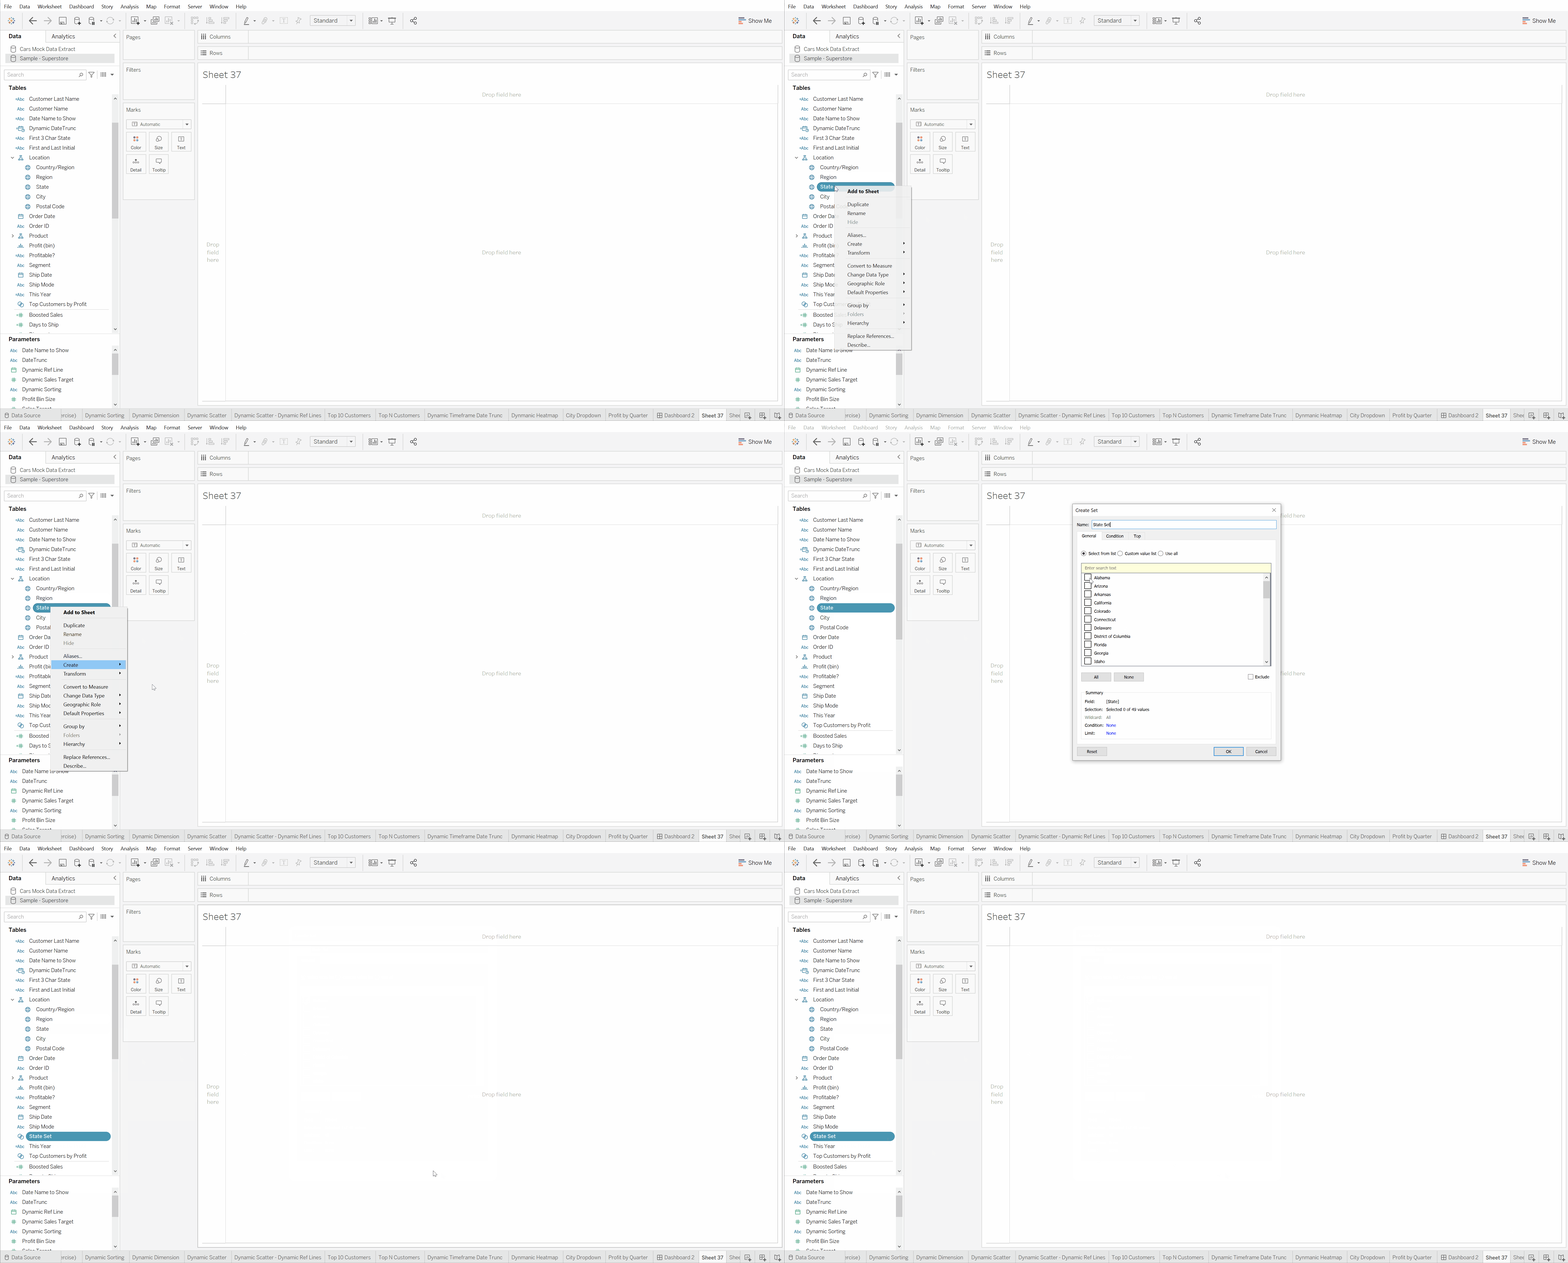
Step 1: Create a Set for the field to be selected (State in this example)
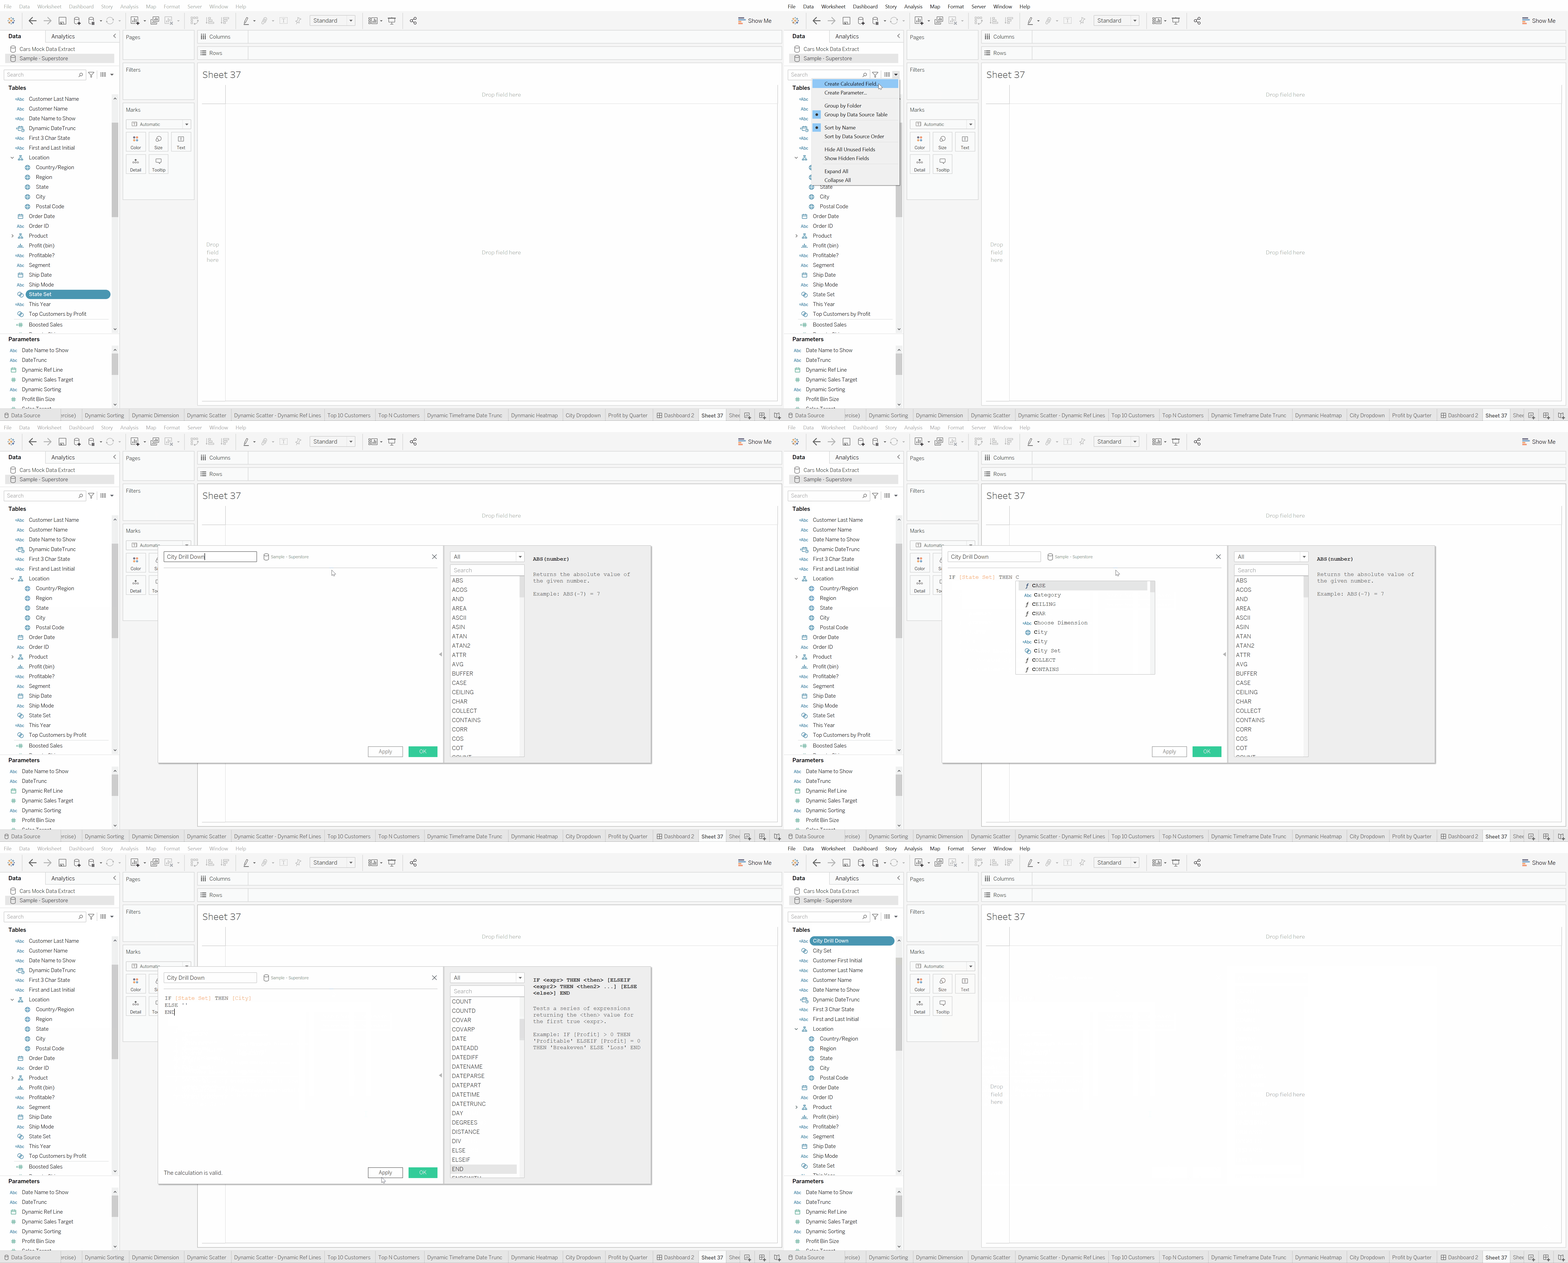
Step 2: Create a Calculated Field for the field to be shown (City in this example)
Step 3: Add the interactivity using Set Action
Set the set action to add more values to the set when the user makes a selection. On the other hand, when the user deselects, the set action removes all members from the set.
PART 2: How to create a 'proportionally highlighted' Chart?
One cool use of Set Action that I really like is proportional brushing. Proportional brushing or highlighting is a way to interactive with data whereby the user can show the proportion of selected items in relation to all items when he/she selects some marks in another chart.
Step 1: Create a Column Bar Chart that is going to be 'proportionally highlighted' by another table/chart
We need to assign the Set that's to be updated by the user's interaction to the colour marks. In this example, I am using the drill down table created in PART 1, so it is the State Set that is to be updated by the user's interaction.
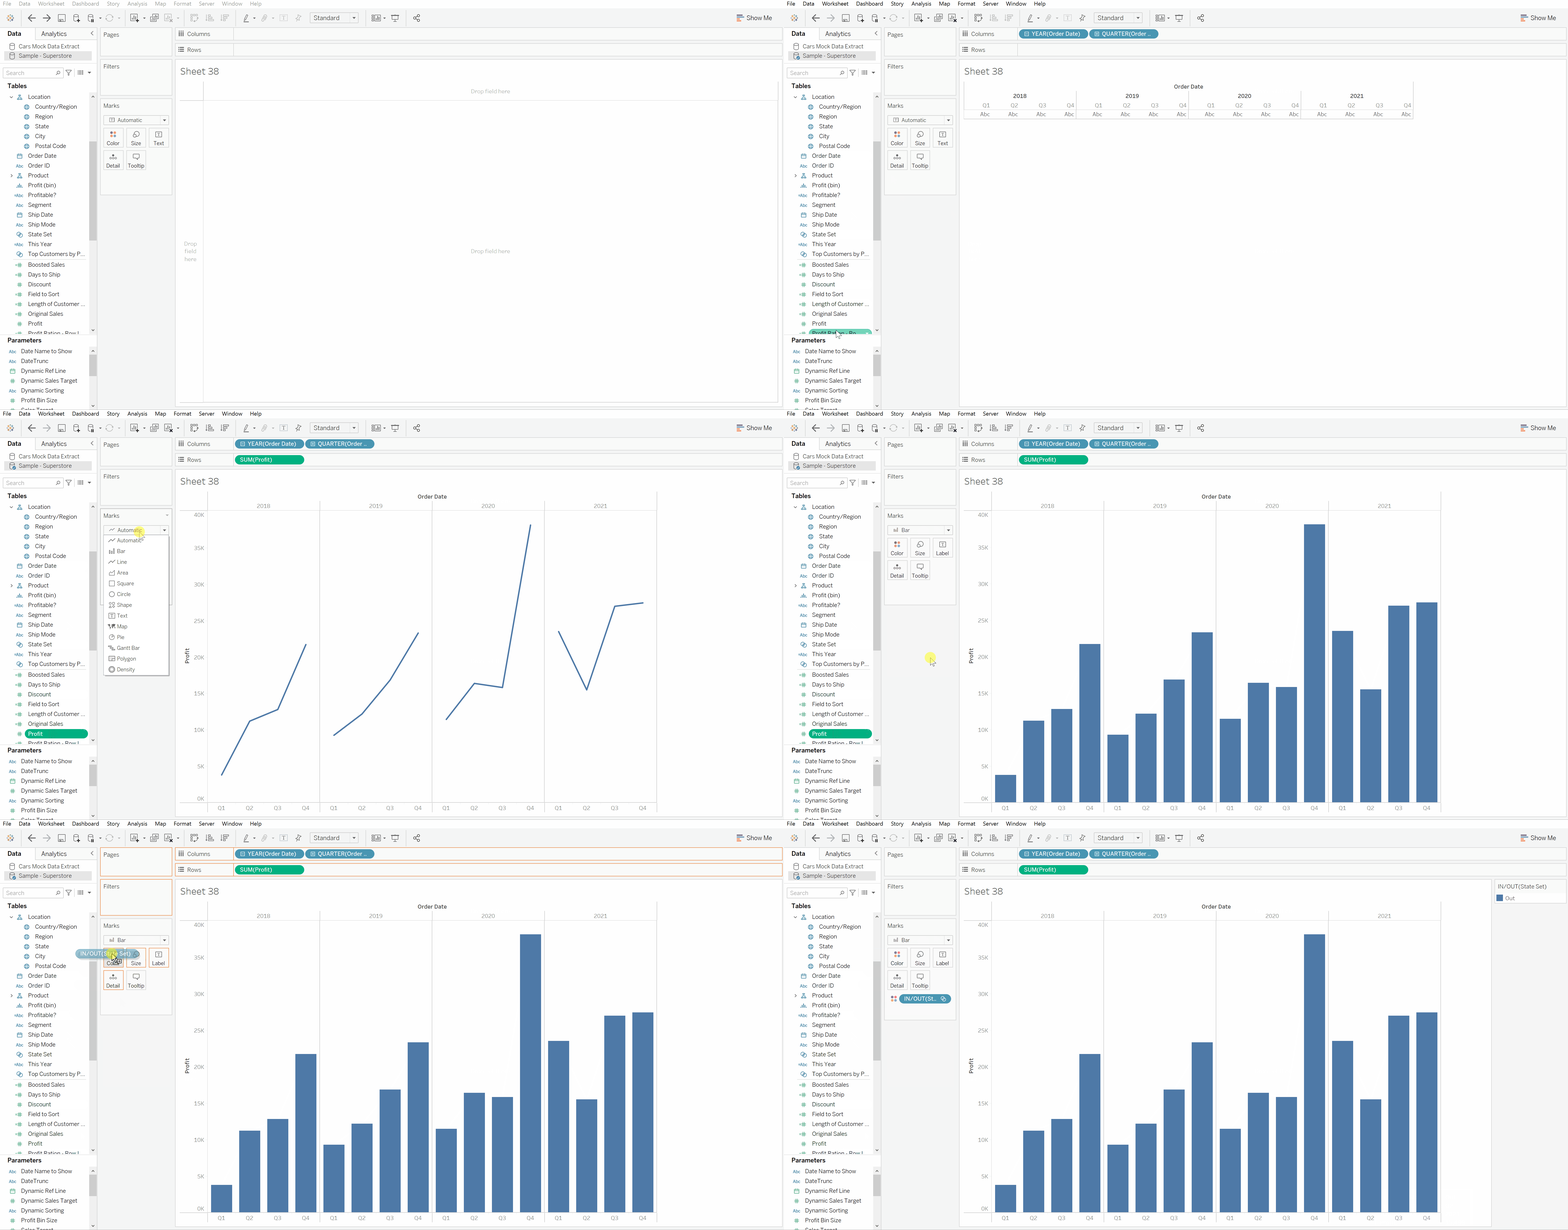
The idea is to assign more values (members) to the State Set when the user click any state in the table. Since the bar chart is coloured by the set of states, the part to which the assigned member of the set corresponds is coloured accordingly.
Step 2: Create a chart/table that is used to highlight the bar chart from step 1
I simply use the drill down table created in PART 1 in this example.
Step 3: Putting things together in Dashboard & Add interactivity using Set Action
