


August 2nd 2021, first blogpost and first day at the Data School. I will start from the very beginning when I first heard about The Information Lab after seeing Tableau posts in LinkedIn and Reddit. I used to use this software for chart visualisations as I find it easier to visualise data than in Excel. After that, I researched about the company and reached out to another Data School Trainee, Amalia, to tell me more about life at The Information Lab and who also helped me A LOT during the application process. DS chats, events and demonstrations were also useful to know about the company, work and its members.
The application process was very different from other long applications from other companies. It made me feel that even if I failed I would have learnt something from it (which I did! And I also made it so even better =D). For my final interview, I had to prepare a Tableau Viz and presentation for 311 Service Request (SR) calls in New York. I completed several drafts and kindly asked Amalia and the DS team for feedback which helped me improve my viz significantly. Presentation went amazing (no questions were asked to me regarding the presentation and good feedback was given during the interview too =D).
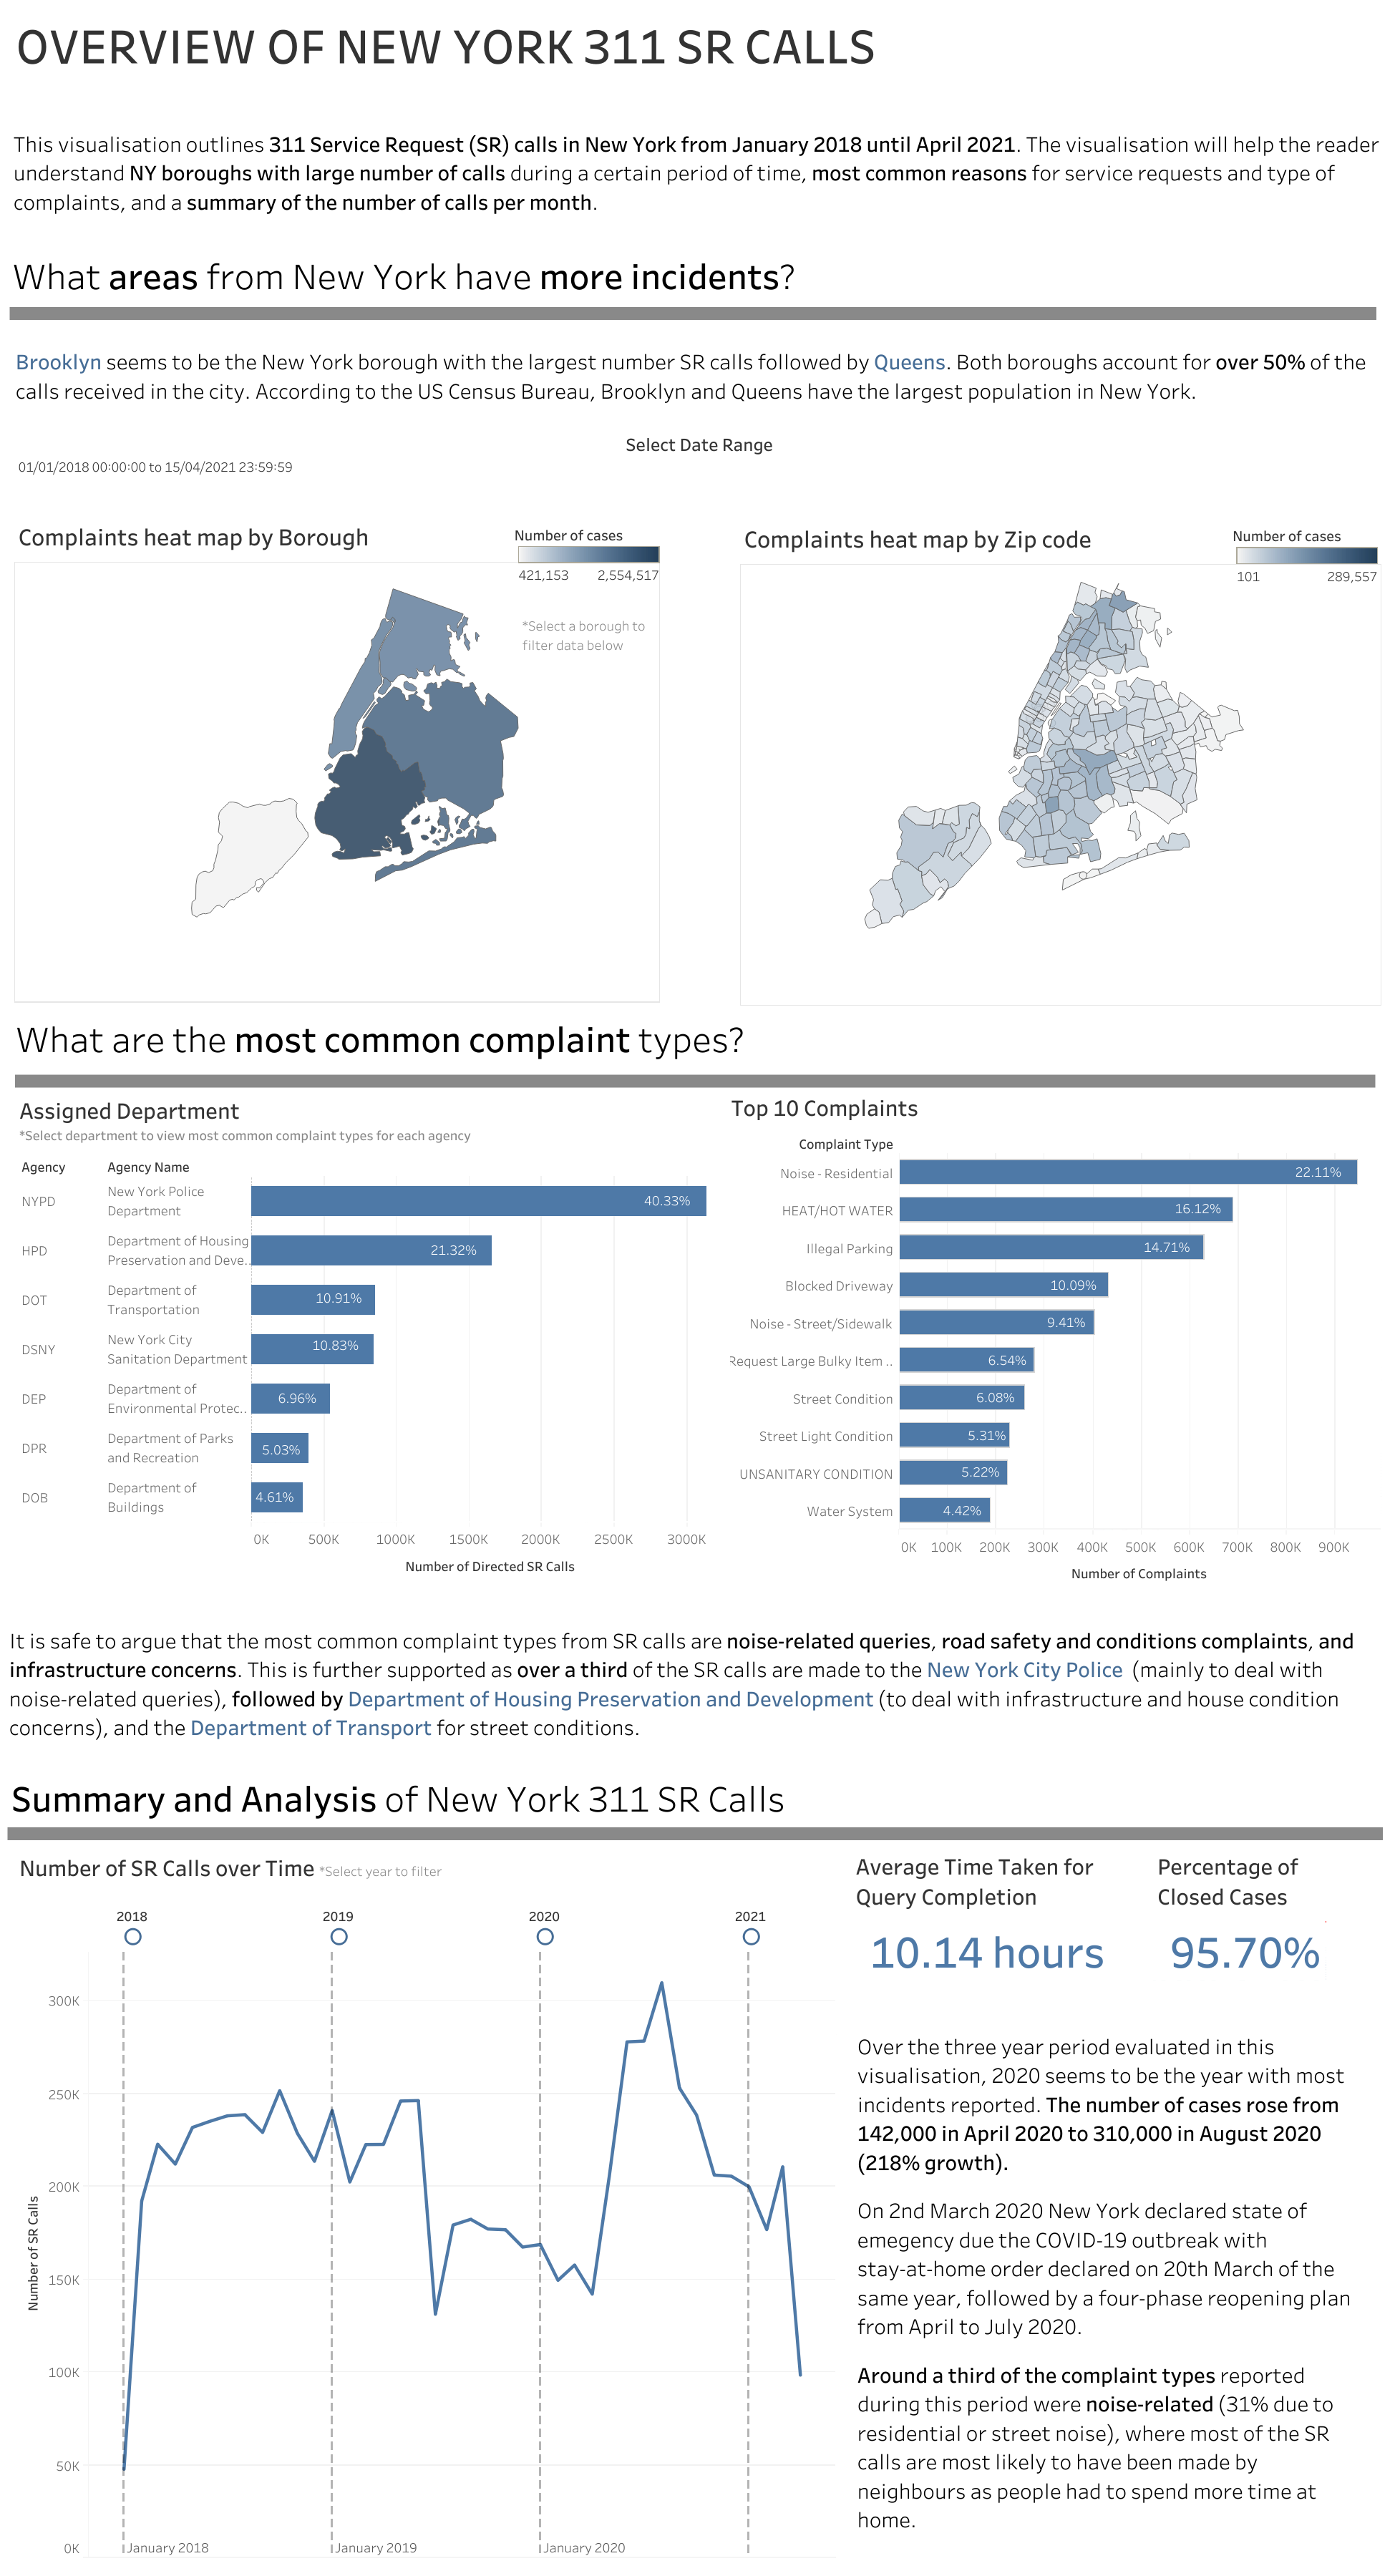
I organised the viz in a way that I was able to cover almost all the aspects of the given data as WHAT type of complaints were made (and WHY), WHERE these complaints came from, WHO helped solving them, and WHEN these problems became a bigger problem. Tableau viz and its link is attached below.
My data visualisation and presentation skills definitely got better during my the application process and will continue to improve further now that I am part of the Data School. Best of luck to future cohorts!