For Day 2 of Dashboard Week, we were given a dataset on an inventory of LEGO pieces. The data was stored on Snowflake, and we needed to use SQL to prepare the data before building a dashboard in Power BI.
9am - 10am
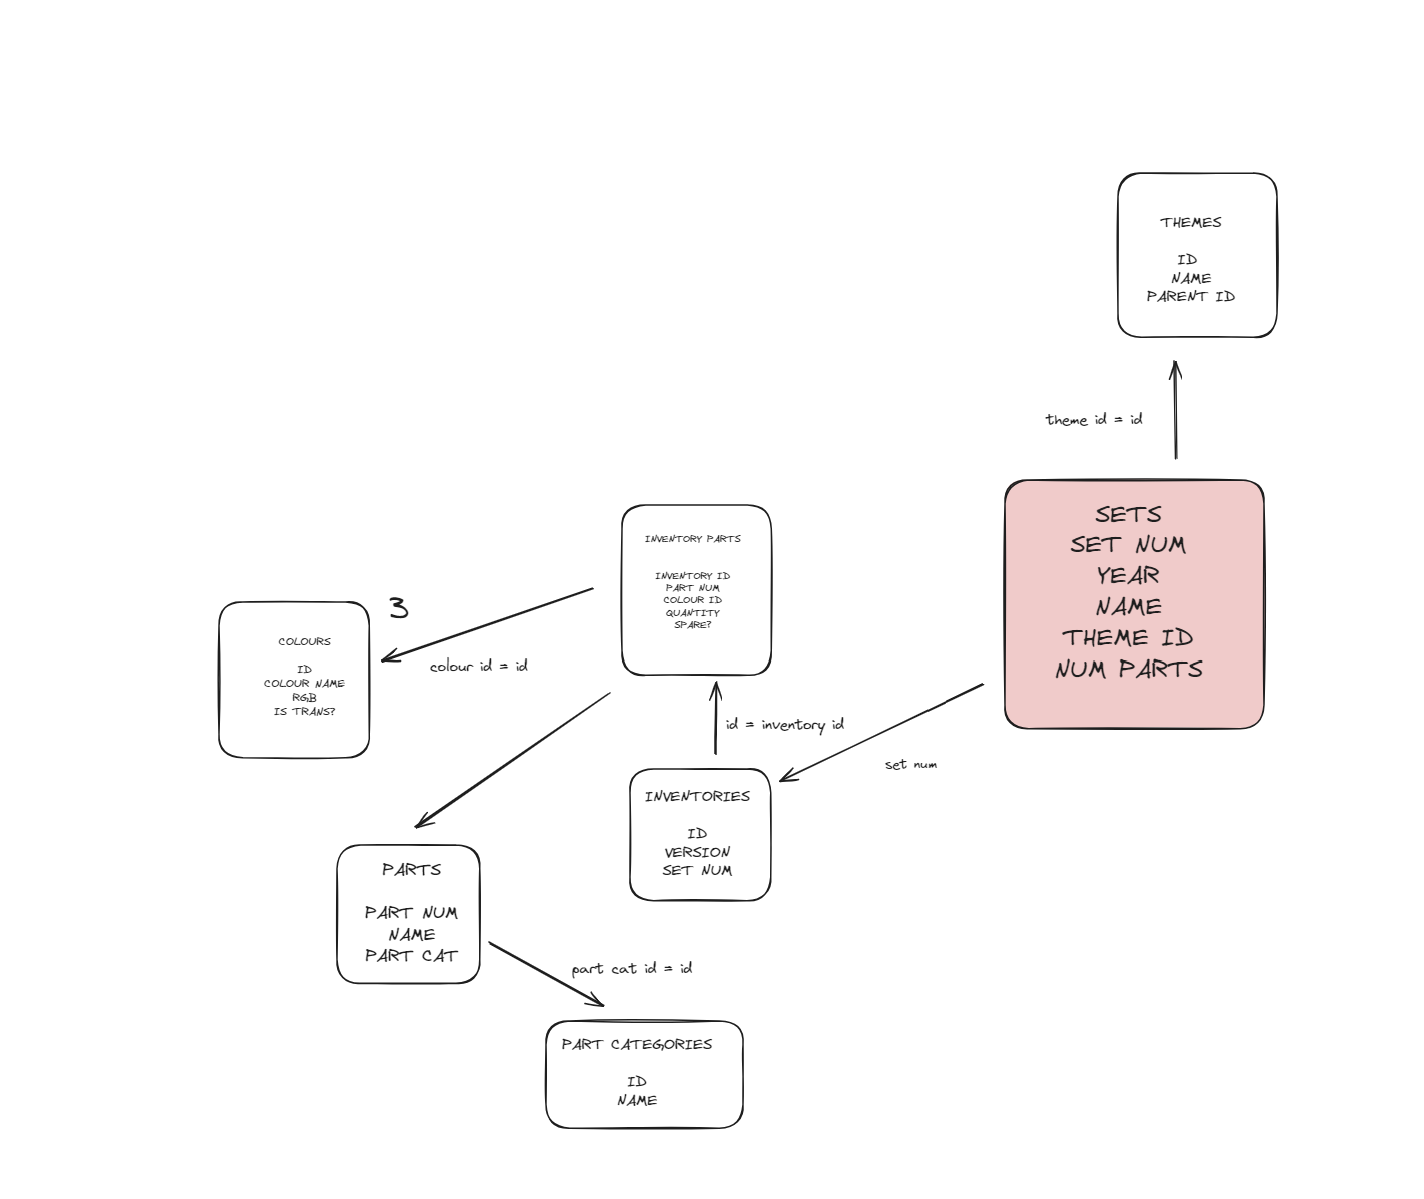
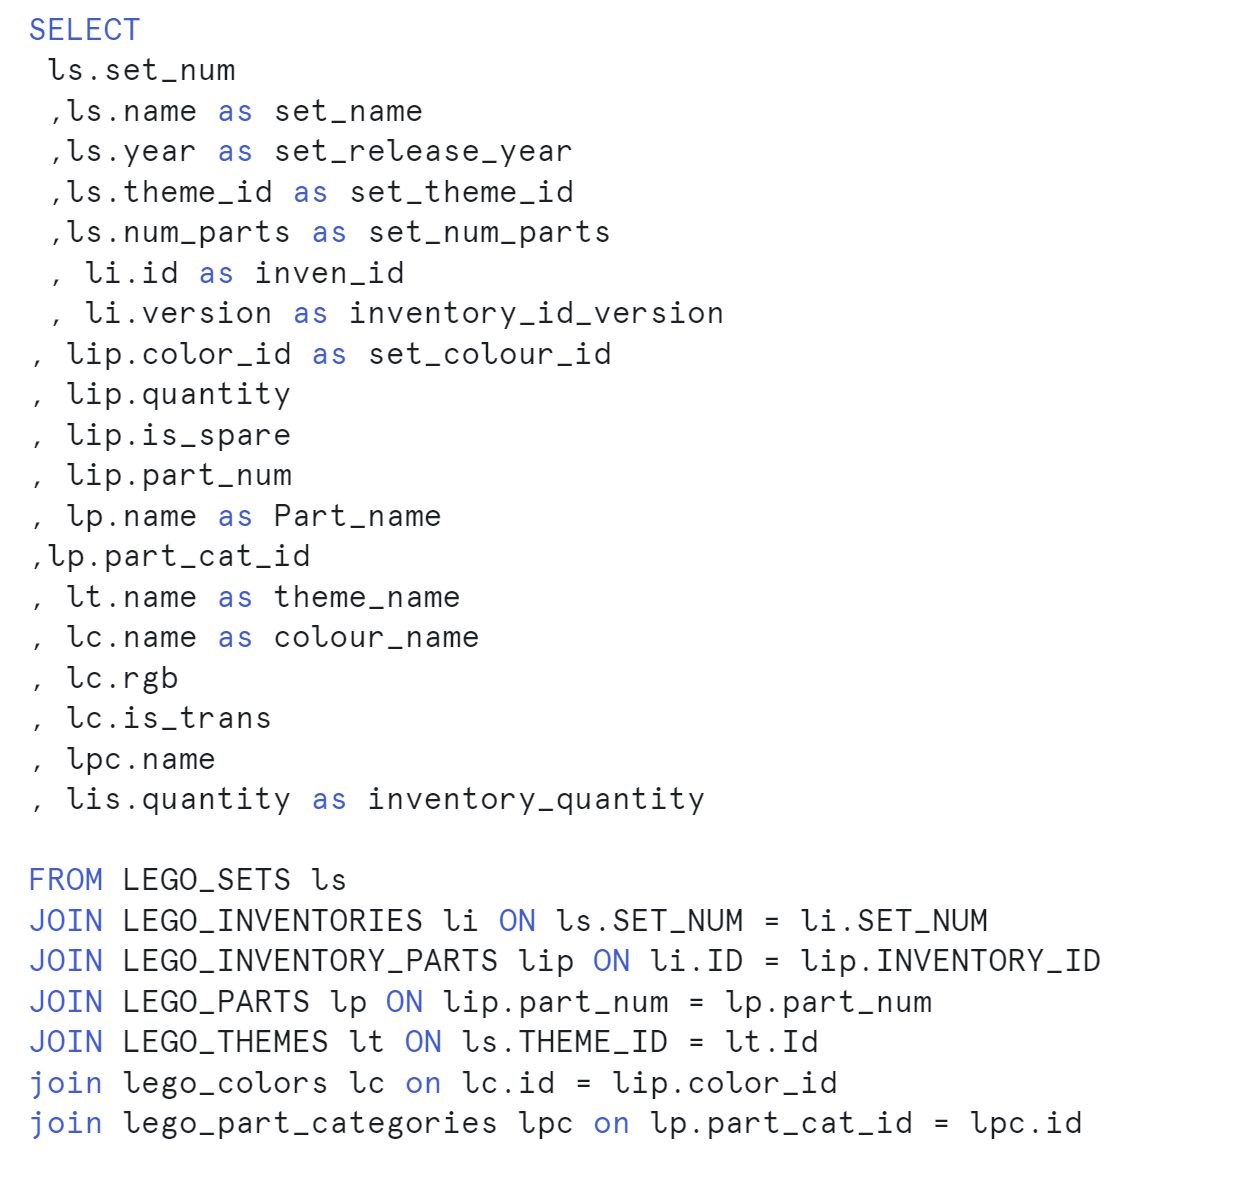
I started with data discovery on snowflake, creating a schema and joining the necessary tables using SQL. Initially, I attempted to join all the tables, but later realized that it was not necessary for my requirements. I then refined my approach and focused on the essential schema and SQL code, as shown below:
10am - 11am
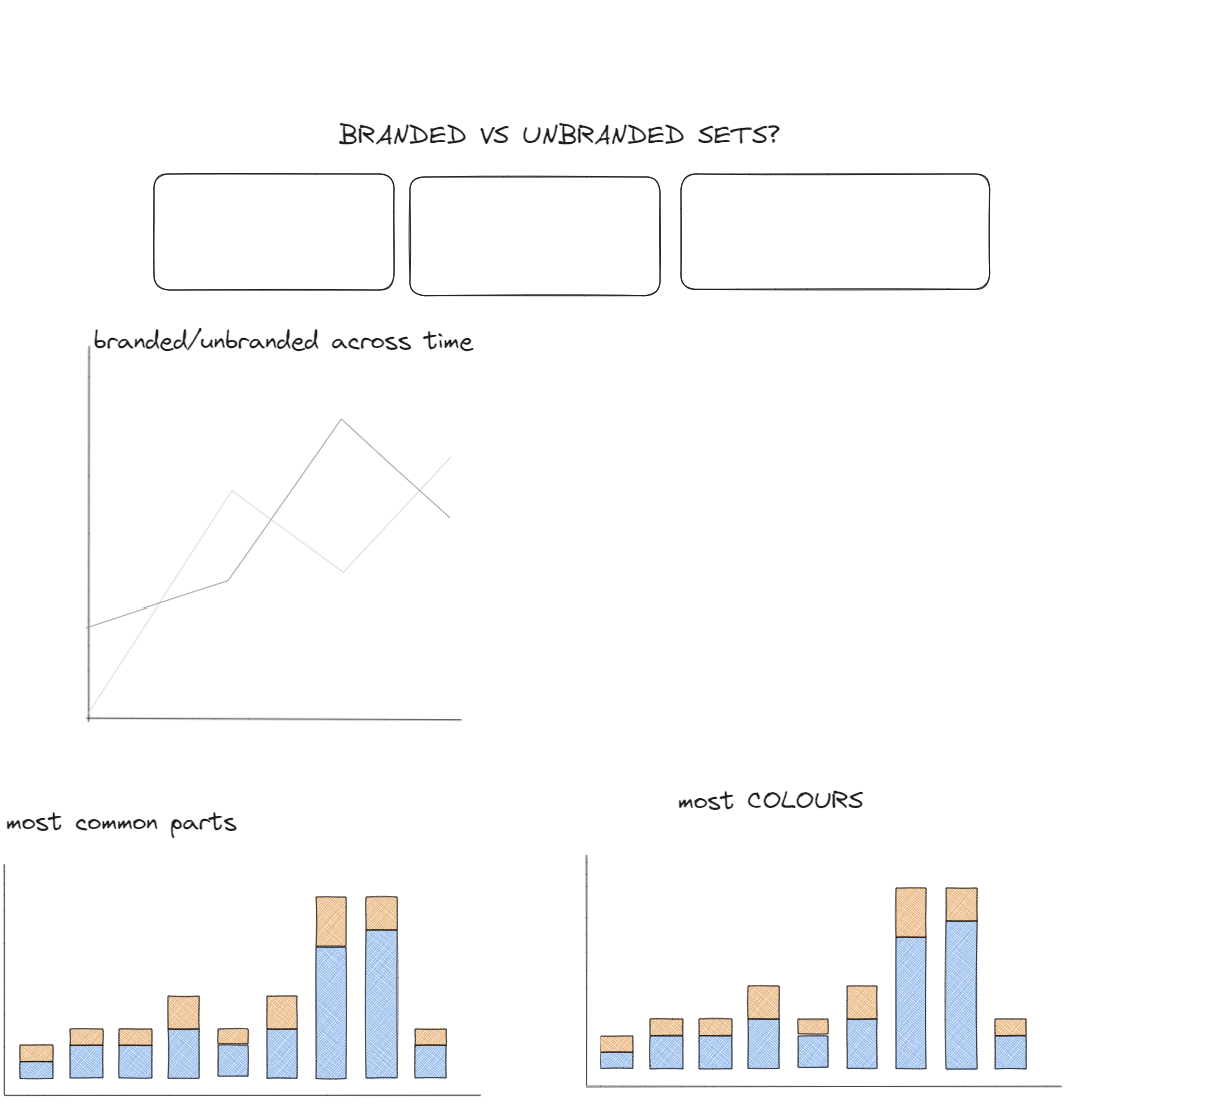
In my second 'Data Discover' session in Power BI, I compared branded/partnership sets like Star Wars and Harry Potter with normal/unbranded sets. While initial observations showed minimal differences in design, I decided to focus on how their release year (1999) and if it impacted their performance. I then quickly mocked up a plan:
11am -3:00pm
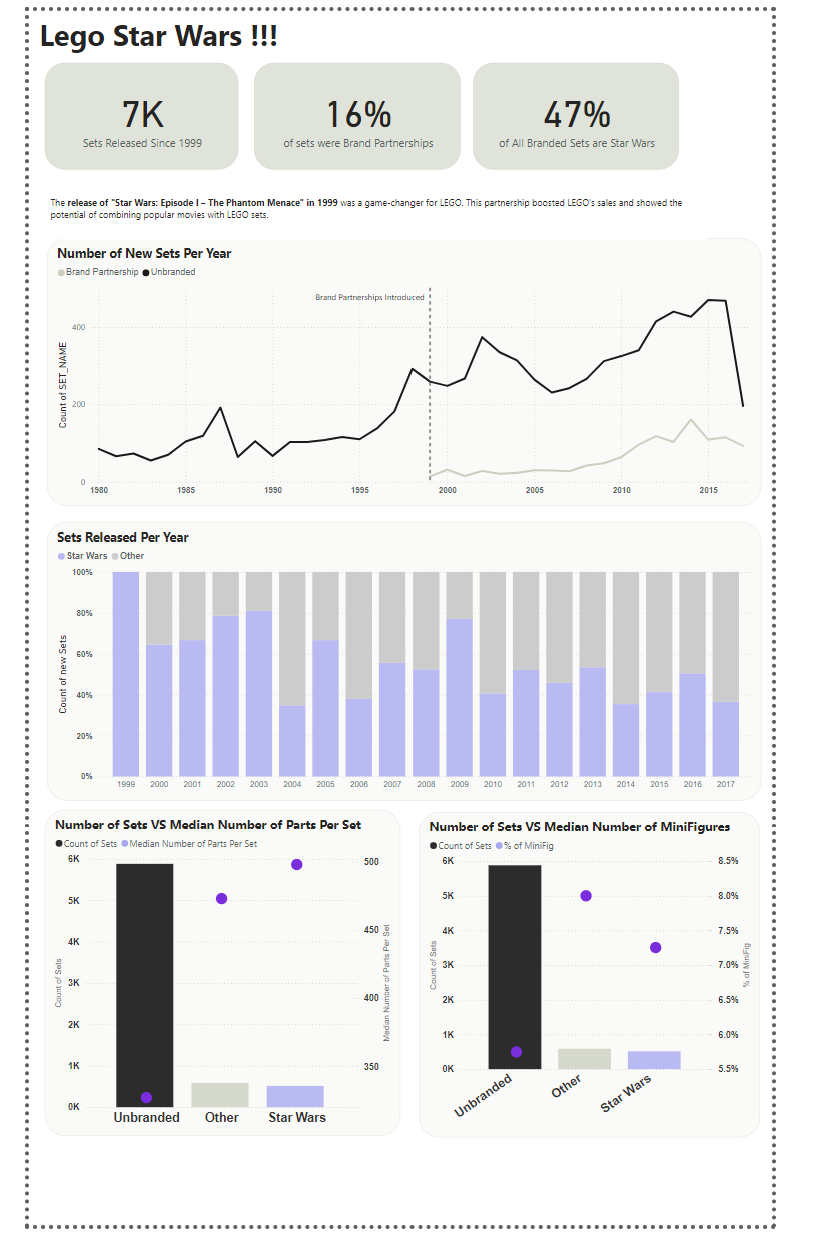
I started by building the necessary charts and calculations. My focus was on comparing Brand Partnerships versus Unbranded Sets, so I created several graphs to explore this narrative. Initially, I didn't find much of a compelling story, but I proceeded anyway. Around 2 PM, I realized that my initial calculation for grouping the 'Brand Partnerships' themes was incorrect and had excluded several themes. After correcting this, it became clear that the main story was actually 'LEGO Star Wars vs. Other Brands.' I quickly adapted my dashboard to reflect this new insight.
My final dashboard ended up looking like below. I wish I had more time to explore the Star Wars VS Other theme, as I found it actually very interesting! I am overall happy with the way it came out, but the layout and explanatory text definitely could do with improvement to help get the story across.