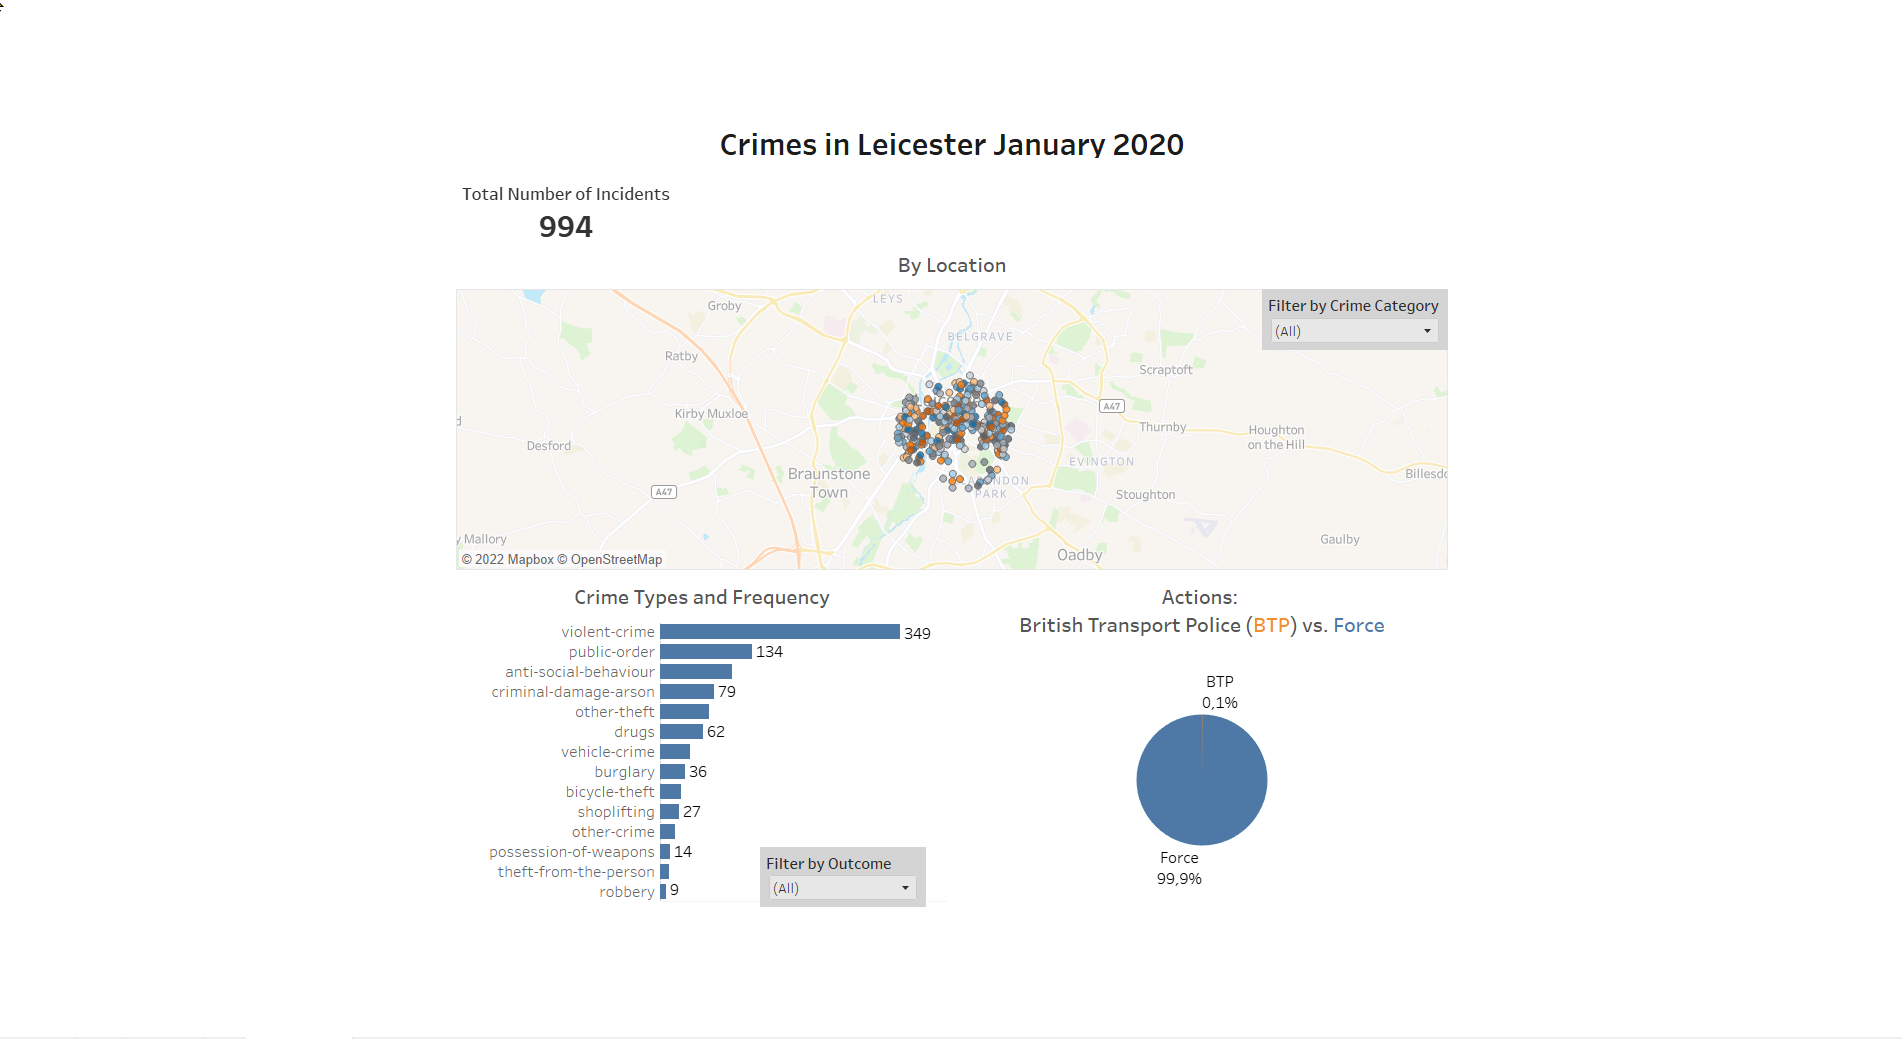
Today we started off with our Dashboard Week. We had to fetch data from the data.police.uk website using an API in Alteryx. This was very challenging because there wasn't any clear API documentation on the website as to what the GET URL was. After a series of 404 Not found and Bad requests upon trying some URLs, it then became apparent that I had to try an example URL which was actually given. The problem with this was that the query was only for a specific area (Leicester) and a specific month and year (January 2020). This still fetched a good number of records and at least I was able to use the output .hyper file to build a few charts depicting the data collected and a website with insight on the types of crimes that were committed in the area by streer name, the number of crimes per crime type, the outcomes or resolutions per crime type as well as who the responders were (the BTP or the Force).

I had some technical difficulties along the way. For some reason, when I connected to the .hyper file from Tableau, my latitutde and longitude columns were not correctly identified latitude and longitude. I tried to assign a geographic role to them, but it wasn't possible from the data pane, so I tried the data source pane. Unfortunately, Tableau had categorised them as string and when I tried to assign a geographic role, I didn't have the latitude and longitude options available. The solution that worked after googling was to first change the data type to number (decimal) and then check the geographic roles again. After I did this, I now had the options available, so I was able to change the data type.

