Screen readers such as window's in-build narrator (which can be turned on and off via windows key + ctrl + enter) sometimes struggle to navigate a Tableau dashboard.
A screen reader cannot access any information inside of charts - even if it is a table! What a screen reader can access is the chart's title, a chart's caption, and a chart's alt text. Fortunately, we can use the fact that titles and captions can be dynamic to give a screen reader user all of the information displayed.
The key trick is that a screen reader does not have eyes - it reads the text regardless of colour or size! This means we can set font size to 1 and set the font colour to the background colour, effectively hiding the title for non-screen reader users.
But how do we approach screen-reader-ifying a chart like this?
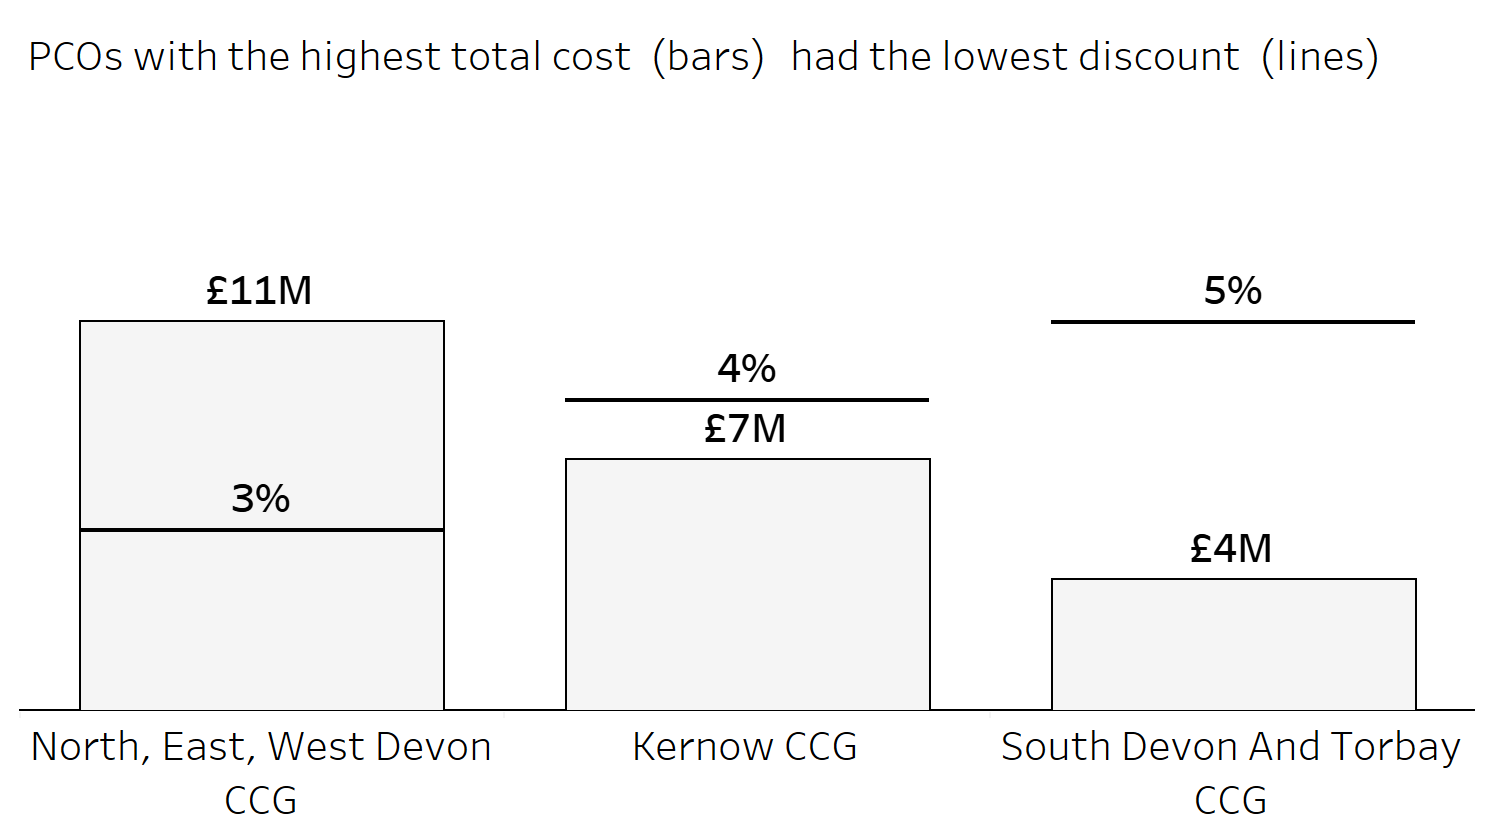
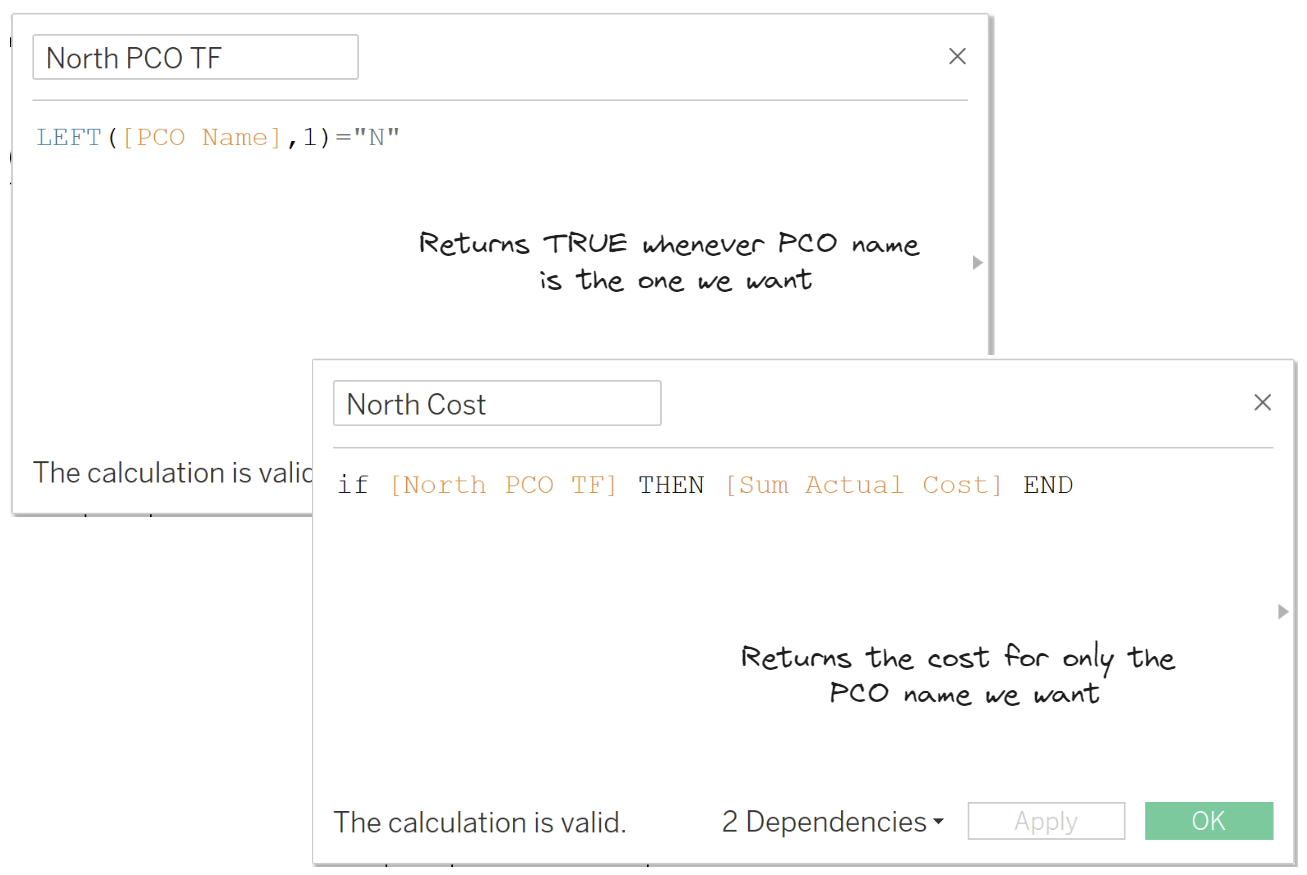
The issue is that adding cost into the title would not suffice. Instead, we can make calculations which give each number on screen, and then add it to the title for the screen reader users. Here is an example for how to get the £11M in the first bar:
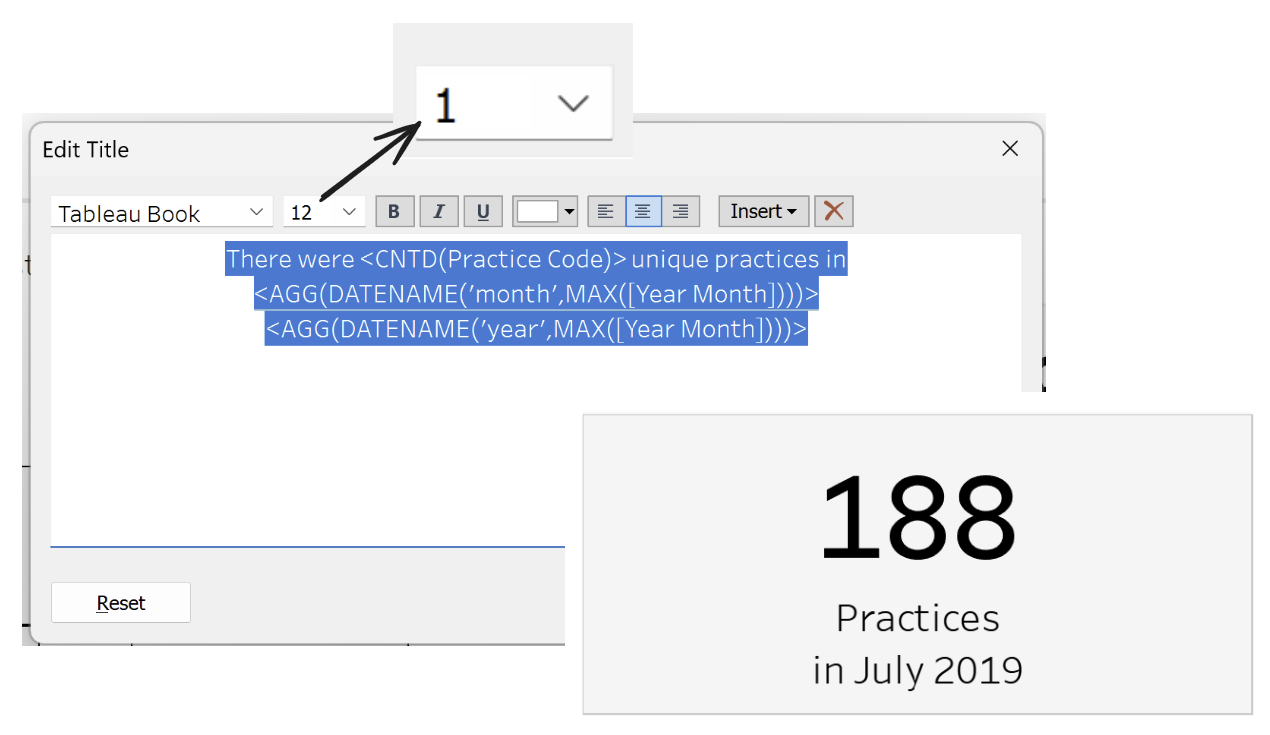
The title for this chart looks like this (with the removed formatting versi0n given):
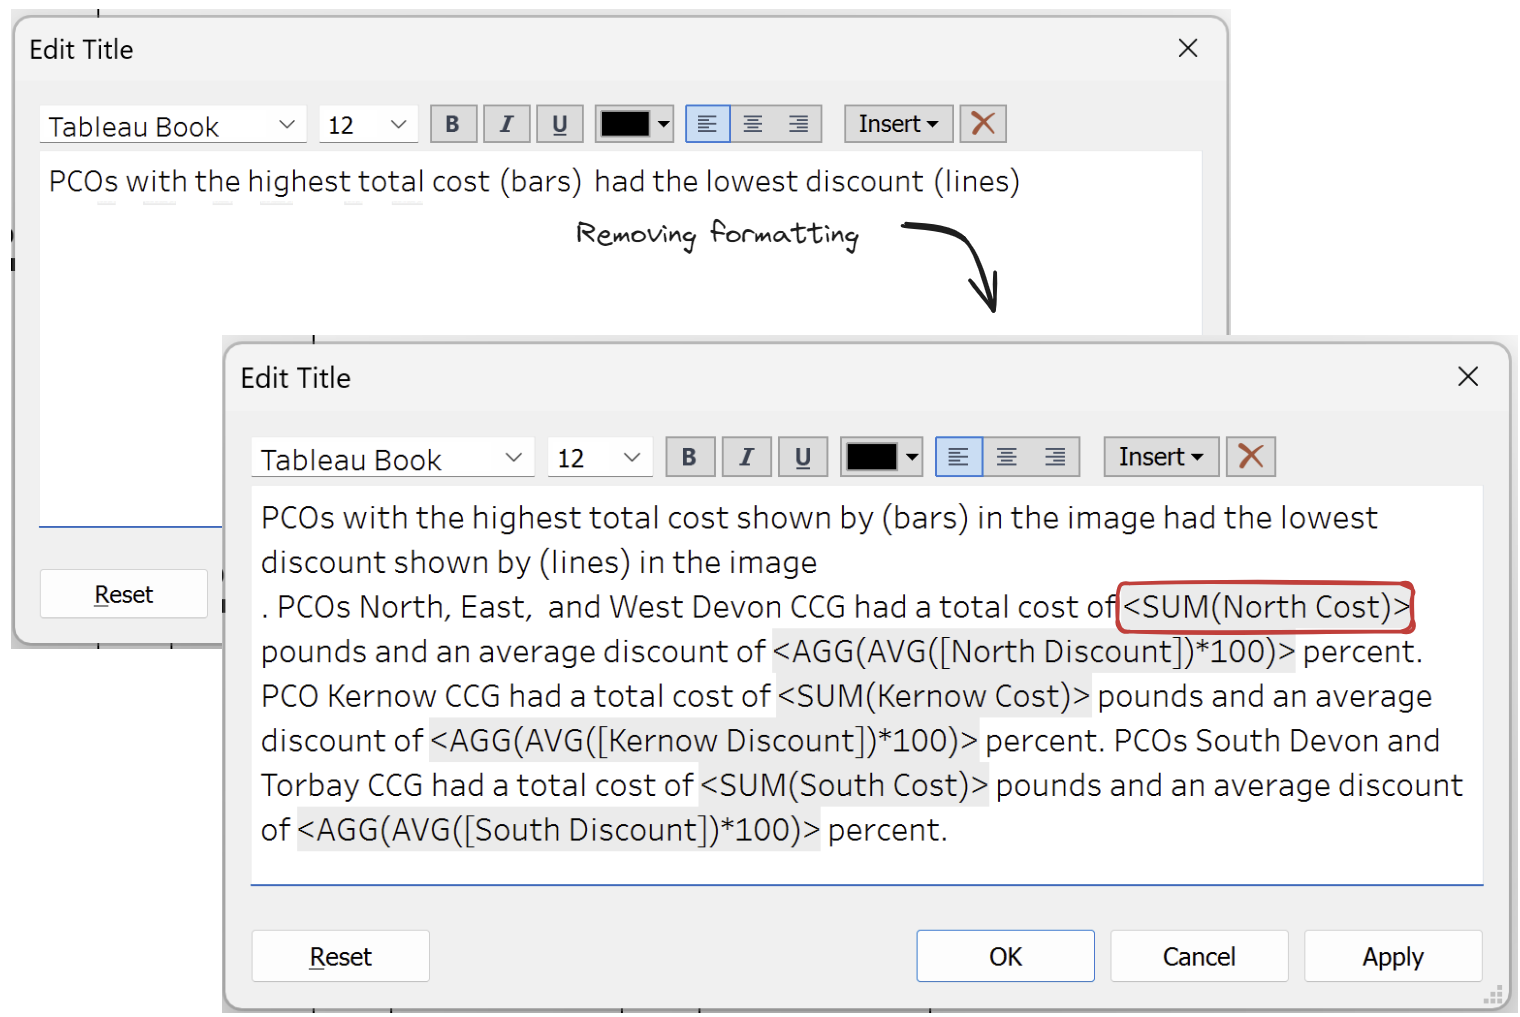
The final trick is adding extra hidden text inside titles which will be only accessible via a screen reader:
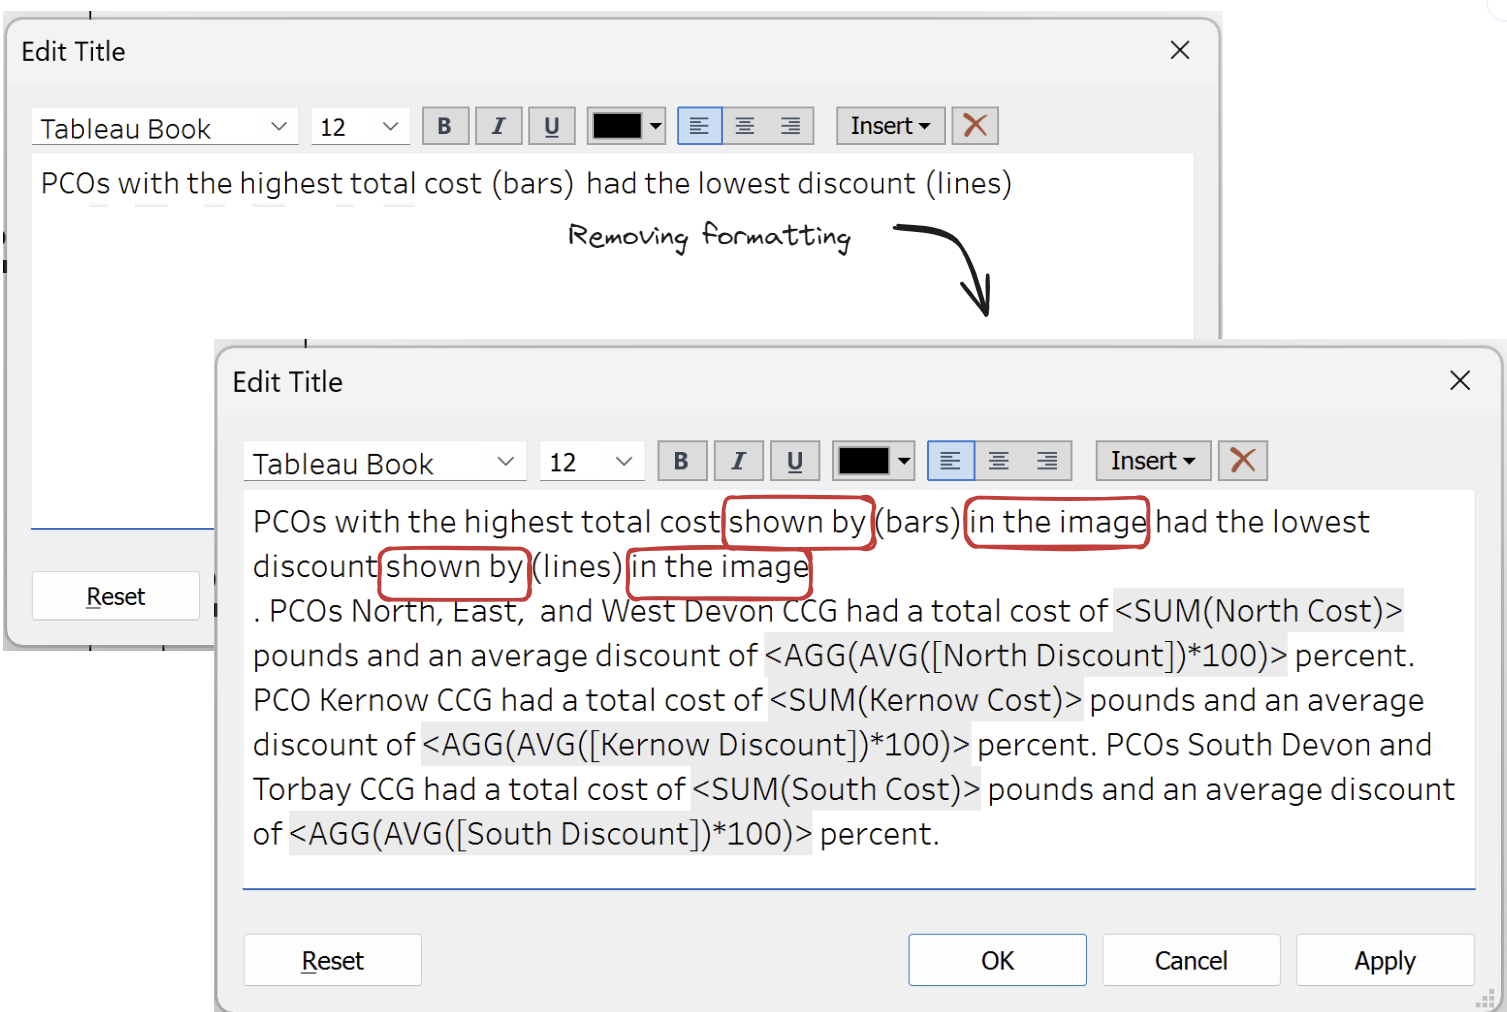
These extra words will be read by the screen reader, demystifying where the "bars" or "lines" are if the user cannot see the chart. For other users, the text gives the illusion of being a space. This ultimately improves the experience of the user.
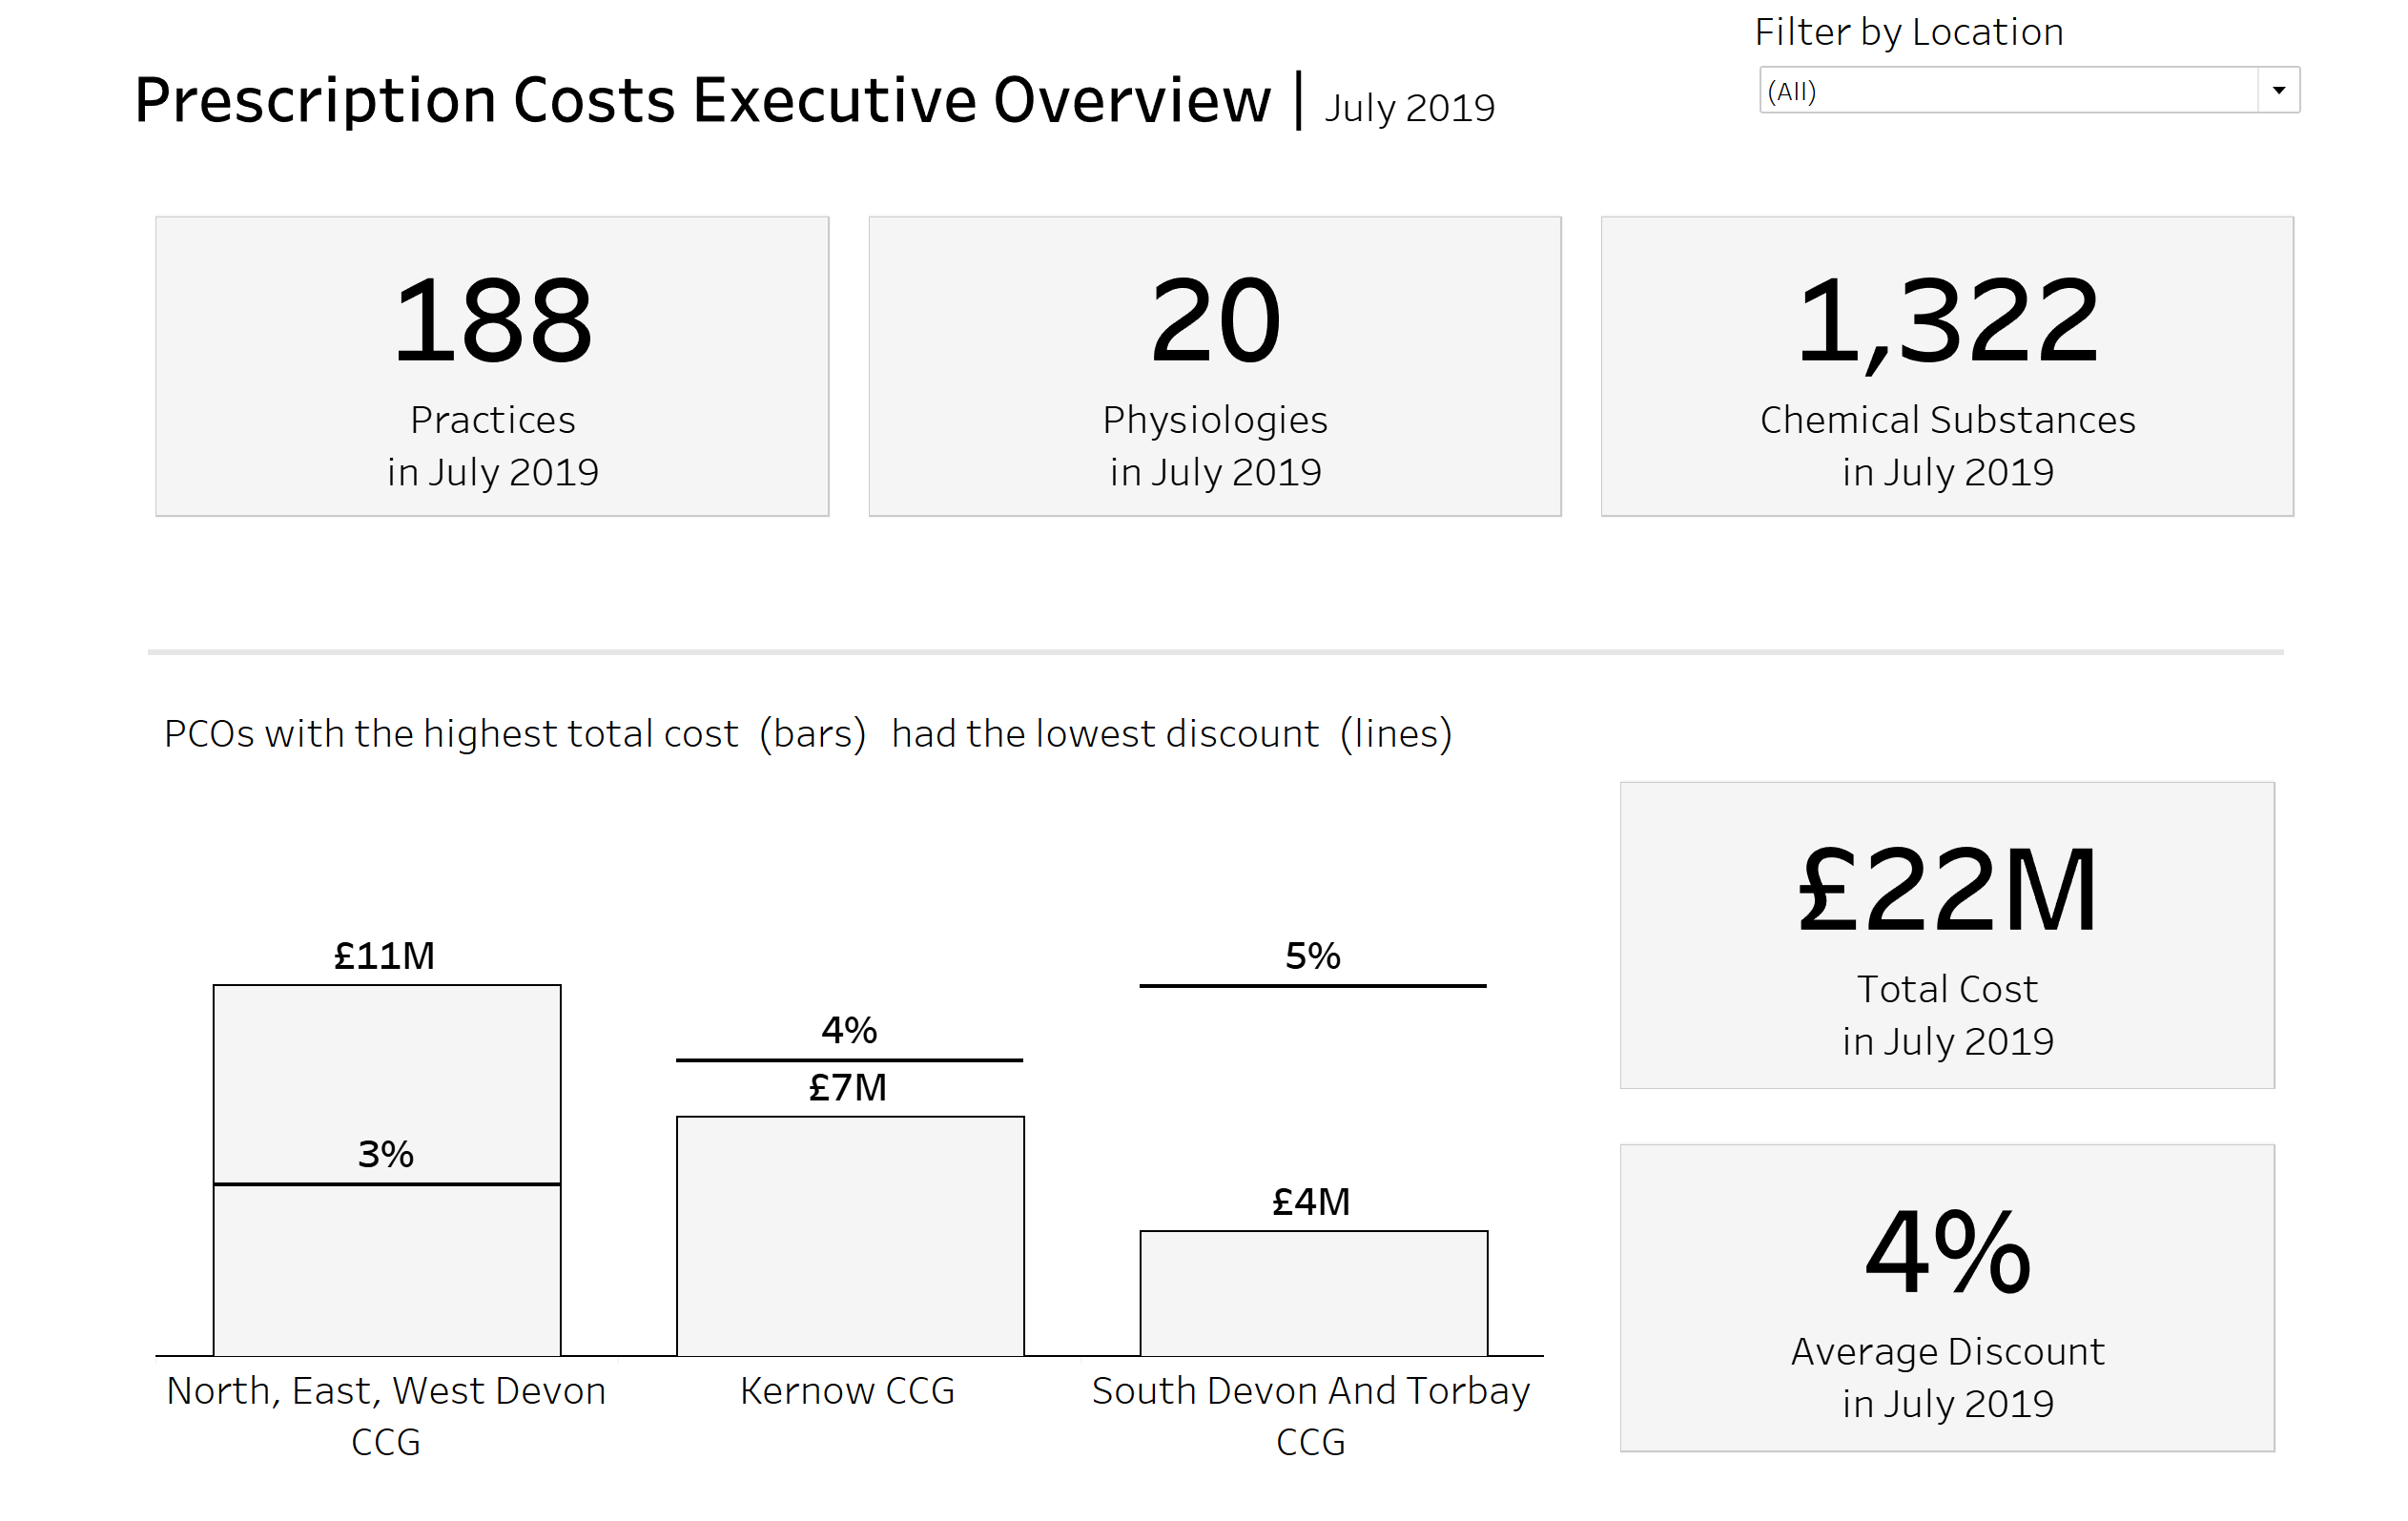
Final dashboard: