


Keywords: Table, record, data field, measure
Before analyzing data it is imperative to clean and (potentially) reshape it so that it is easier to analyze and work with. Whether you are working in a software like Tableau or Power BI or you are building a Python algorithm to generate visualizations, if your data is dirty it will be much harder to parse through it and acquire the information you need.
But what does data even look like? It is a term that we throw around often and, amidst the AI boom, data has become even more pertinent across industries. So, as public knowledge and perceptions about data change over the course of this technological shift, it’s great to have a foundational understanding of data, specifically data structures. Once you understand the basic structure of data it becomes much easier to Know Your Data (KYD) and determine if your datasets are” dirty!”
In this blog post I will be using Tableau Prep to illustrate the salience of data structures as we work through a basic data cleaning and reshaping exercise. A brief overview of concepts we’ll go over:
- Data Structures - Terms and logic.
- ‘Dirty’ Data - how to spot errors and awkwardly organized data.
- Cleaning and Reshaping Data - Via Tableau Prep.
Data Structures
Data can come in multiple different forms—all shapes and sizes—such as a flat file (csv, xlsx, etc.) to data lakes and lakehouses, but, fundamentally, most data structures follow a basic logic.

Note: We use the variable “n” because when working with big data the rows and columns can reach absurdly large numbers (e.g. 10^9, 10^11, 10^12).
As a rule of thumb, the general Rules of Data Structures:
- One row for each record/ transaction.
- One data type for each field (e.g. Categorical info, integer, boolean, etc.).
- One data field for each category of measure.
If you remember these rules and couple it with the logic and terminology of pristine data architecture then it will be much easier to spot dirty data.
Dirty Data
Dirty data can be a pain but with our newfound knowledge of data structures we can clean and manipulate the shape of data to acquire the insights we need.
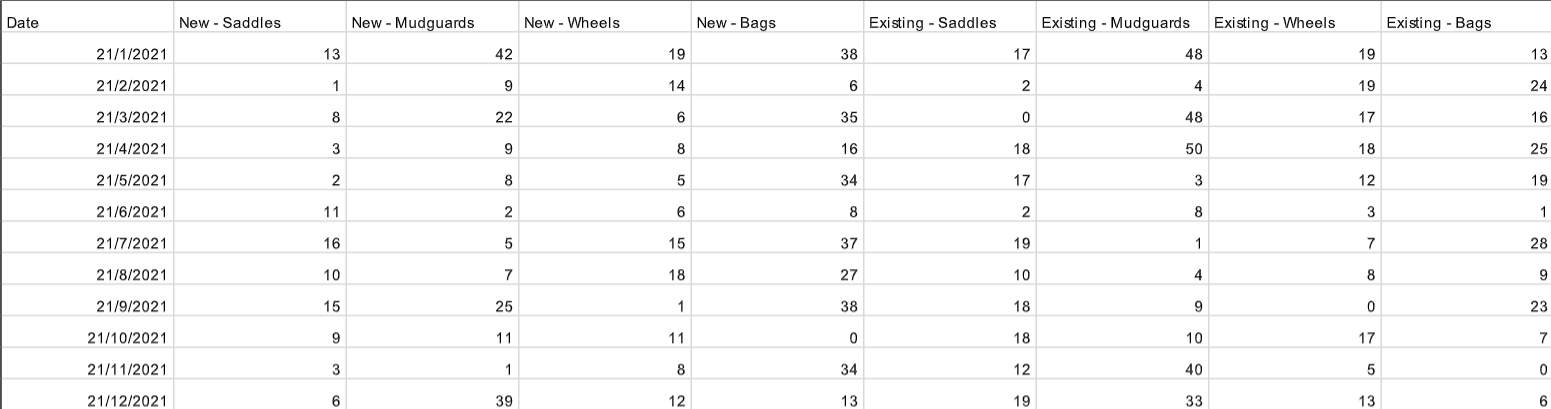
The current table breaks a few rules of data structures and, as a result, it is not intuitive to read or analyze. For example, in the non-date data fields, we have two categories in each field:
- The Customer Type, denoted as ‘New’ or ‘Existing’
- Products, which are ‘Saddles’, ‘Mudgards’, ‘Wheels’ etc.
As a result, these erroneous header names make it difficult to contextualize our measure values. Some other common indicators that your data is dirty are:
- Missing values
- Records split across multiple rows
- Out of date data
Cleaning and Reshaping
Now that we understand data structures and dirty data, we can begin cleaning and reshaping its structure based on the insights we are trying to gain. But, before we start working in Tableau Prep it is best practice to come up with a plan of attack. First, we determine the current state of our data (KYD) and, then, our desired state. A great way to map out this process visually is sketching!
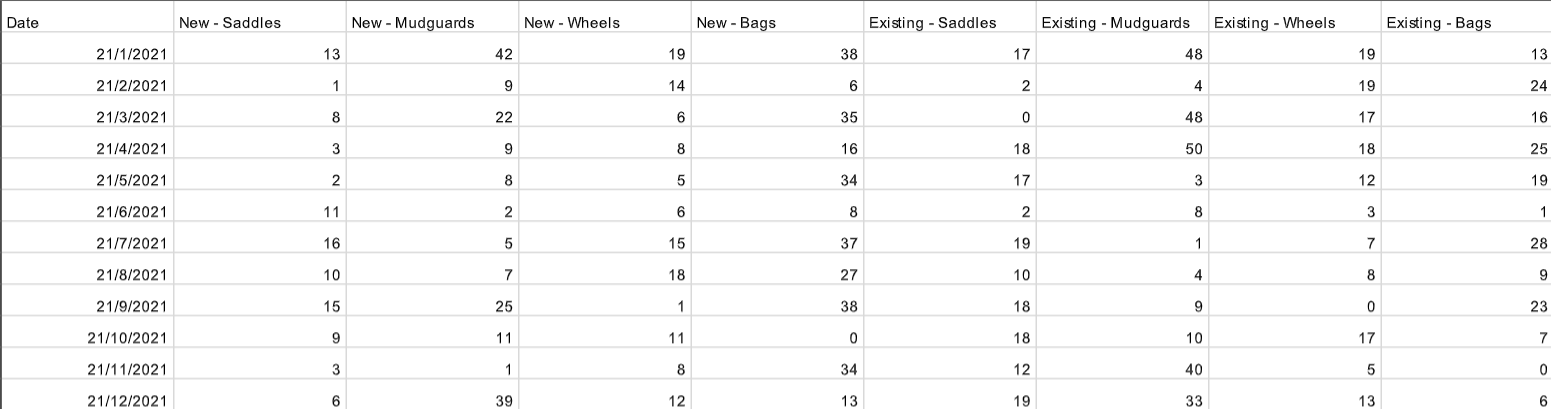
Again, here’s our input. For reference, we have 5 tables where each table represents a different store!
- London
- Manchester
- York
- Leeds
- Birmingham
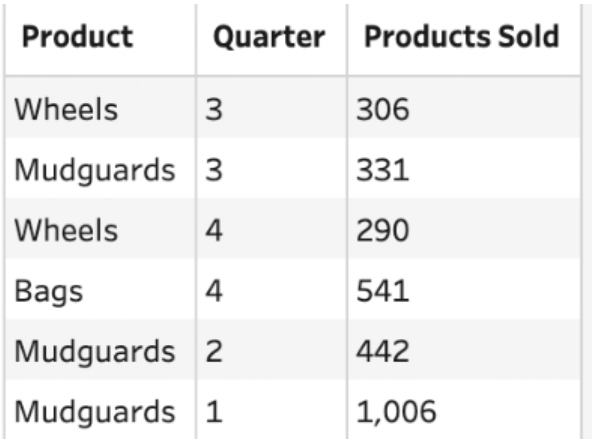
And this is a view of the output we want. We want the quantity of products sold across all 5 stores for each product each quarter
Below I have drawn a sketch that outlines the exact steps we will take to get to our final data table.
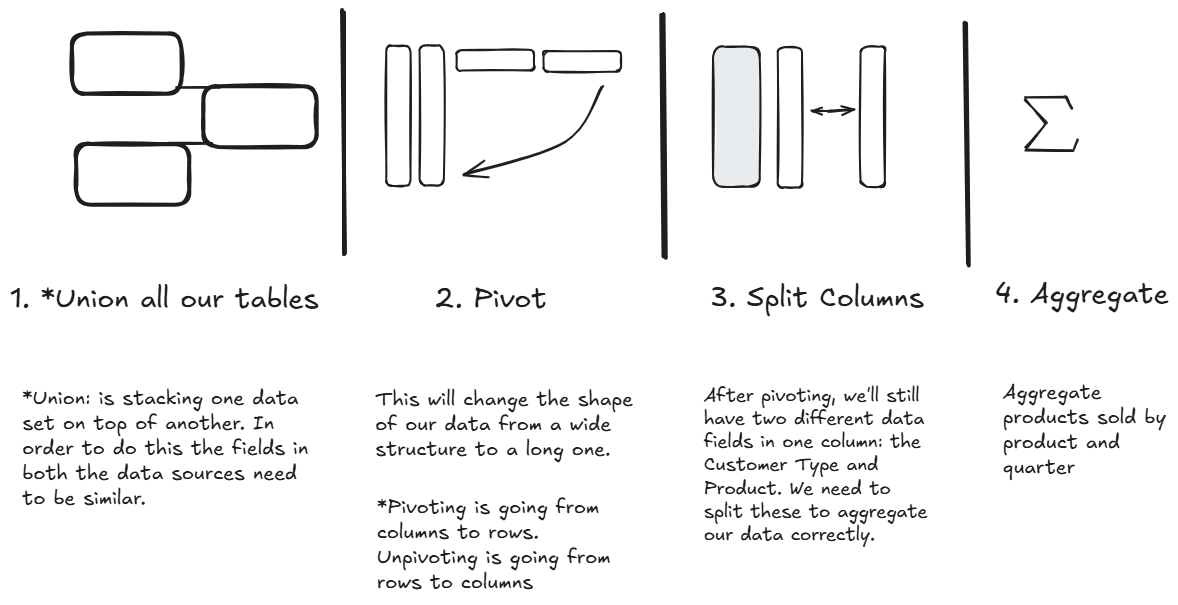
Step 1 - Union
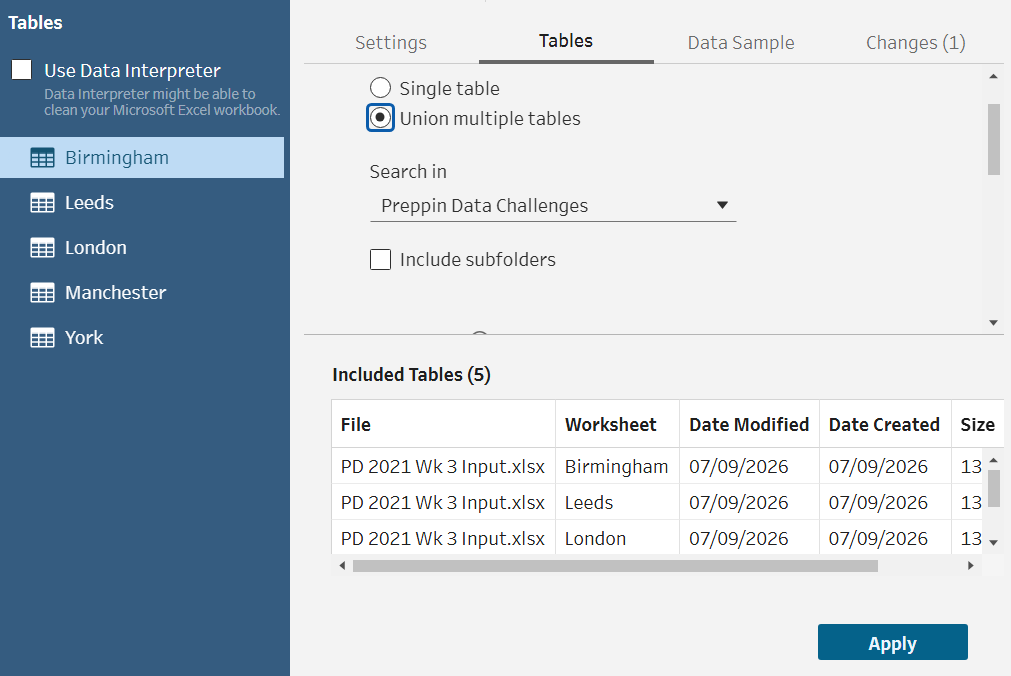
First, we are going to stack our dataset. You can do this by dragging and dropping one of the store tables to the flow, then going to the ‘Tables’ tab and select the radio button that says ‘Union multiple tables’
Step 2 - Pivot
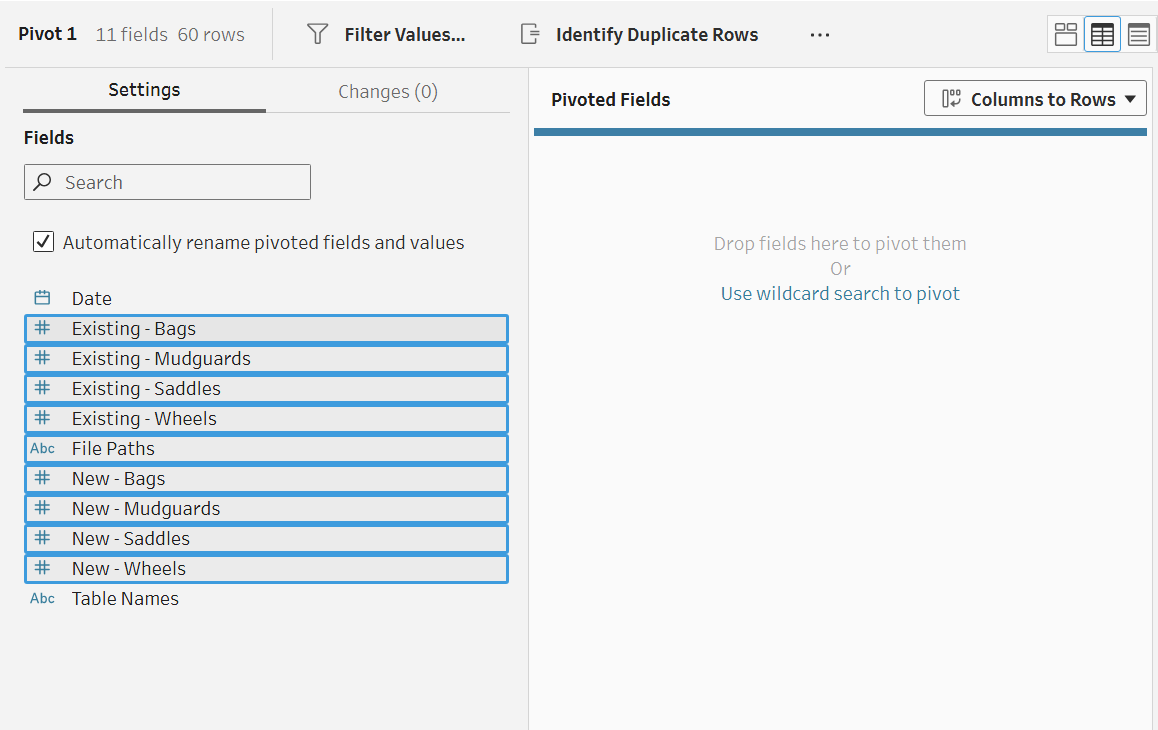
Now that we have our tables unionized we are going to pivot our columns to rows. You can do this in Tableau Prep by adding a ‘Pivot’ step in the workflow. Then drag and drop all the fields that you want to pivot into the ‘Pivoted Fields’ section.
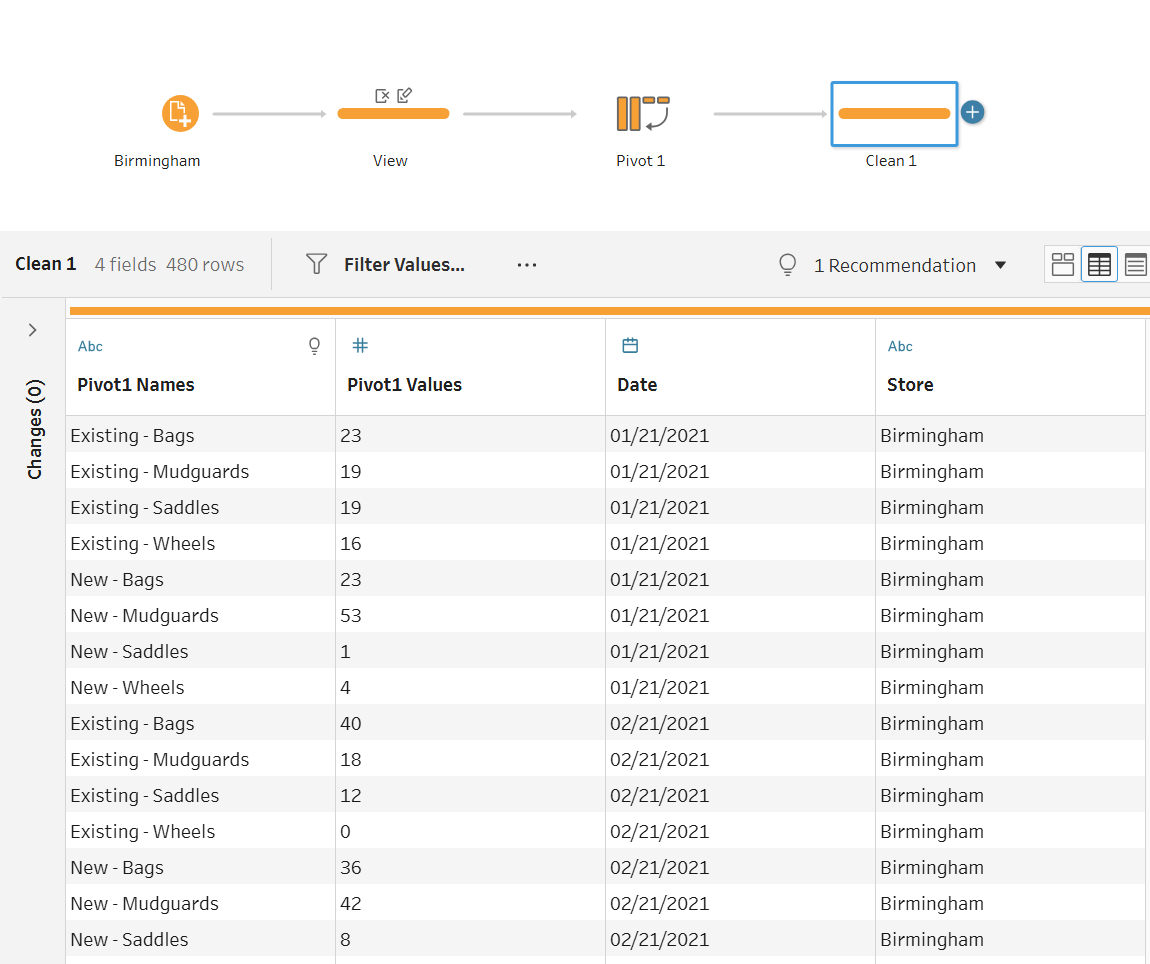
After you pivot, you should have something like this:
Step 3 - Split Columns + Clean
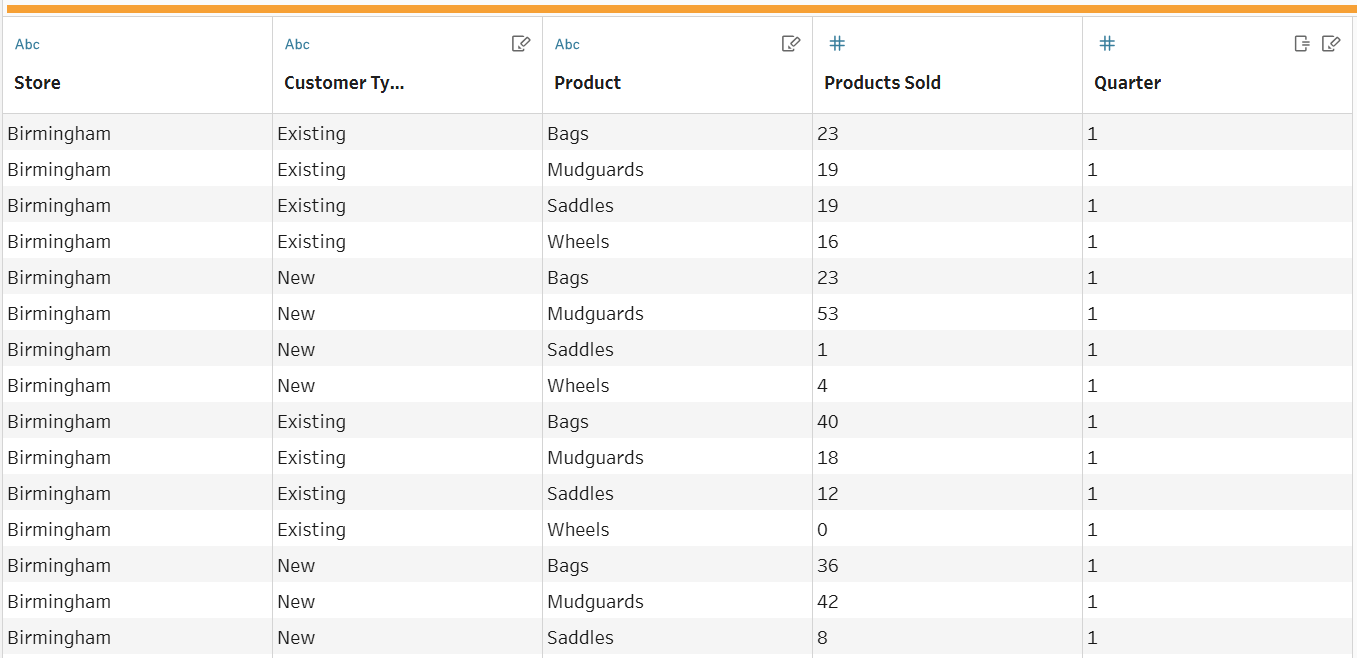
The primary purpose of this clean step is to split our ‘Pivot1 Names’ column on the dash to obtain two separate data fields: Customer Type and Product. But, Tableau Prep has a mechanism that automatically renames our headers after a pivot. So, to maintain the cleanliness of our data we will also rename all our headers in this step, leaving us with the following header names:
- Store
- Customer Type
- Product
- Products Sold
- Quarter
We can’t forget to change our Date data field to quarters! Luckily, Tableau Prep has a function that automatically consolidates individual dates into quarters. Just go to your Date field, navigate to the ellipses, then locate the ‘Convert Dates’ drop down menu and select ‘Quarter.’
Step 4 - Aggregate
Remember this exercise wanted us to aggregate the quantity of products sold by product and quarter—we can do this by adding an aggregate step in Tableau Prep. Then we put our Grouped Fields (Product and Quarter) and Aggregate Fields (Products Sold) in their respective bins.
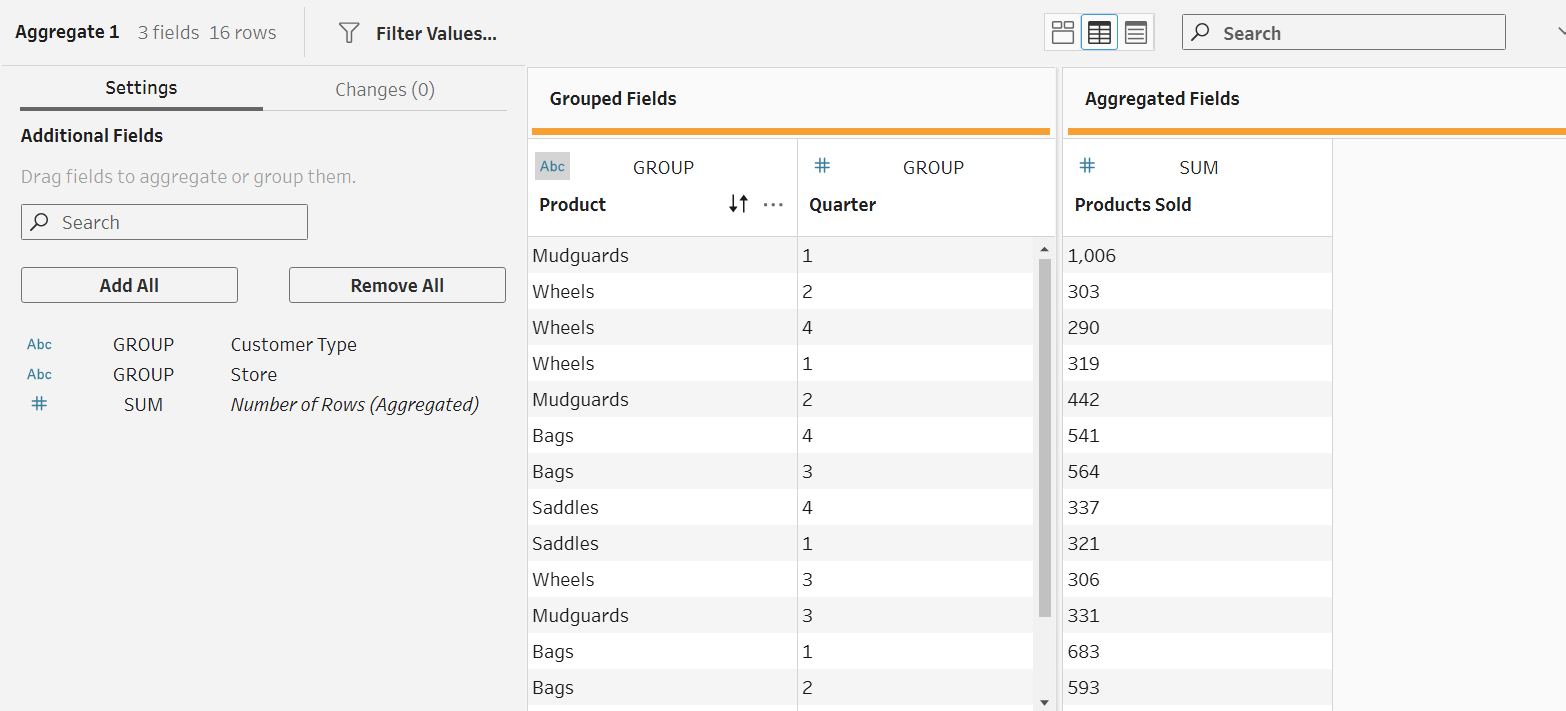
In the end, we get our desired data table!
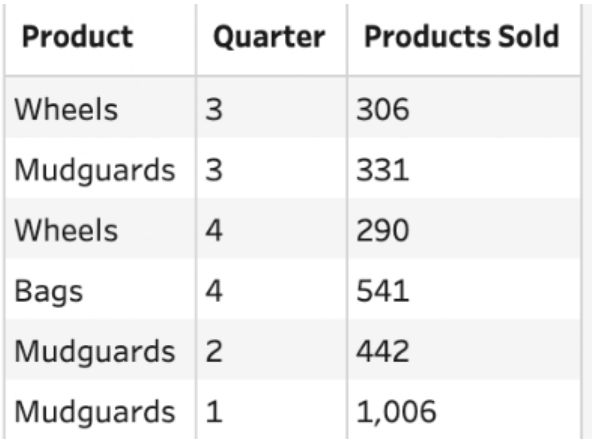
That is how you clean and reshape data in Tableau Prep! By understanding the logic of data structures, preparing raw data for analysis becomes much easier and efficient.