How do you make a dashboard for a business analyst? As a data analytics consultant, we often work with clients that are in a specific sector of the business, from marketing to supply chain to executives. And, for each different kind of stakeholder, they are interested in a specific part of the business, thus, dashboards are customized for a part of the business.
However, one stakeholder I have yet to work with is the business analyst. This is a role somewhat adjacent to mine, however, the primary difference between the two is that the business analyst is expected to apply and communicate the business logic of visuals to inform strategy. Of course, at The Information Lab, we are trained to do that as well, but, generally, this isn’t always the case. So, with this dashboard I challenged myself to build a dashboard that a business analyst could use to analyze various business metrics (i.e. sales) on a regional and temporal basis. Furthermore, given that this user often works cross-functionally, such as with other teams like marketing or supply chain, I added additional functionality that would give the business analyst a breadth of use cases for the dashboard.
In this blog, I will walk through a few use cases that the business analyst might undergo and how this dashboard helps answer pivotal questions. Imagine you are a business analyst…
Case 1: The Executive
Assume the year is 2024, The vice president of technology just sent an email out inquiring about acquiring a small technology company in the western region. He’s really impressed with their new cutting-edge copier and thinks that if the Superstore starts selling them they will boost our sales for the technology sector. The small tech company’s selling price is $50k. Is this acquisition worth the cost?
As a business analyst in this scenario, the first thing I would do is check the temperature of our technology market on the west coast to determine if our technology sales in that region are even profitable. I can do that by partitioning the data in the navigation bar:
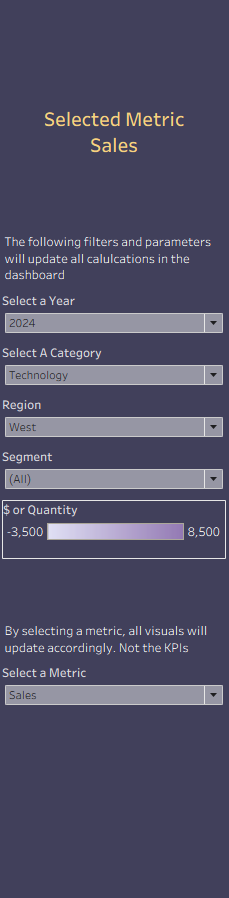
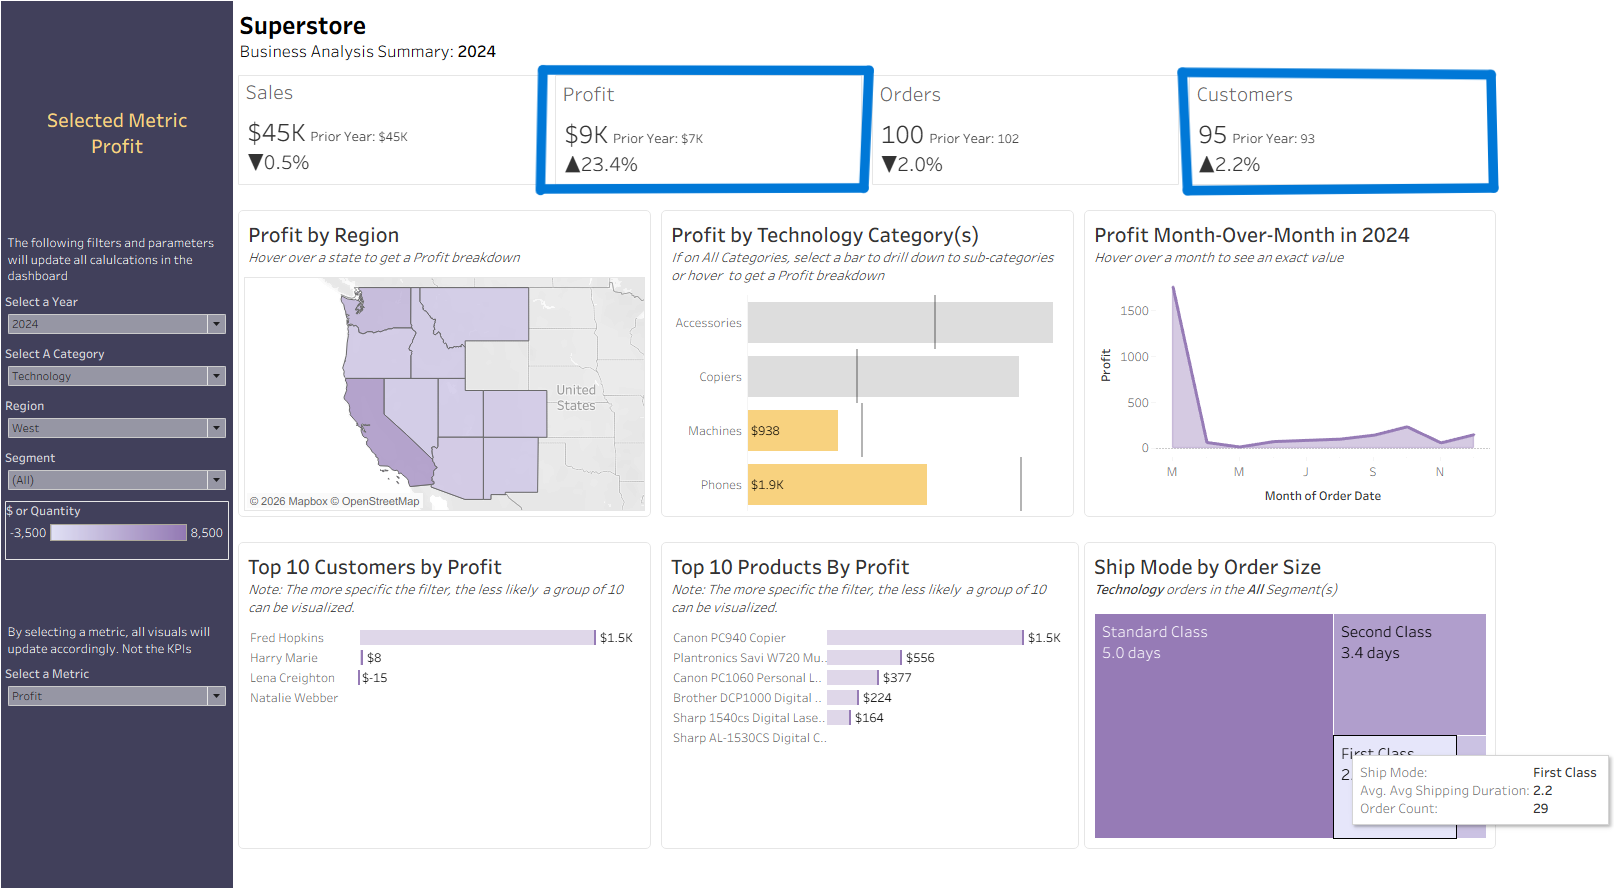
Immediately, I can see that our technology profit and customers that bought technology products has gone up from last year! This lets me know that the western region has a solid market.
The second visual question I would need to answer is: how well have copiers, specifically, been selling in comparison to other technology products.?
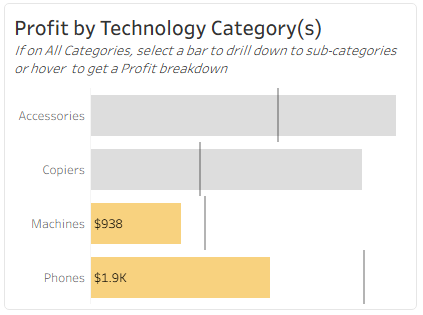
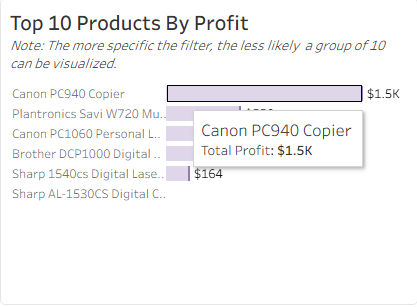
With this bar graph, I can confidently conclude that copiers sell very well in comparison to other sub-categories. In fact, if I look at the graph right below it, the Canon PC940 Copier was our best selling product in the western region.
Altogether, with this information, I can make the following conclusions:
- The western region is a relatively profitable area for technology products.
- In the west, our customer base is increasing from the previous year.
- However, as a business, our profit in 2024 was only $34k. Perhaps we should negotiate the smaller company’s asking price?
Case 2: The Marketing Team
The marketing team is interested in developing a campaign to target our corporate customers in the eastern region. Who should they target and which products should they focus on advertising?
As a business analyst, I would configure the dashboard to show profit in the eastern region among the corporate segment. See partitioned data below.
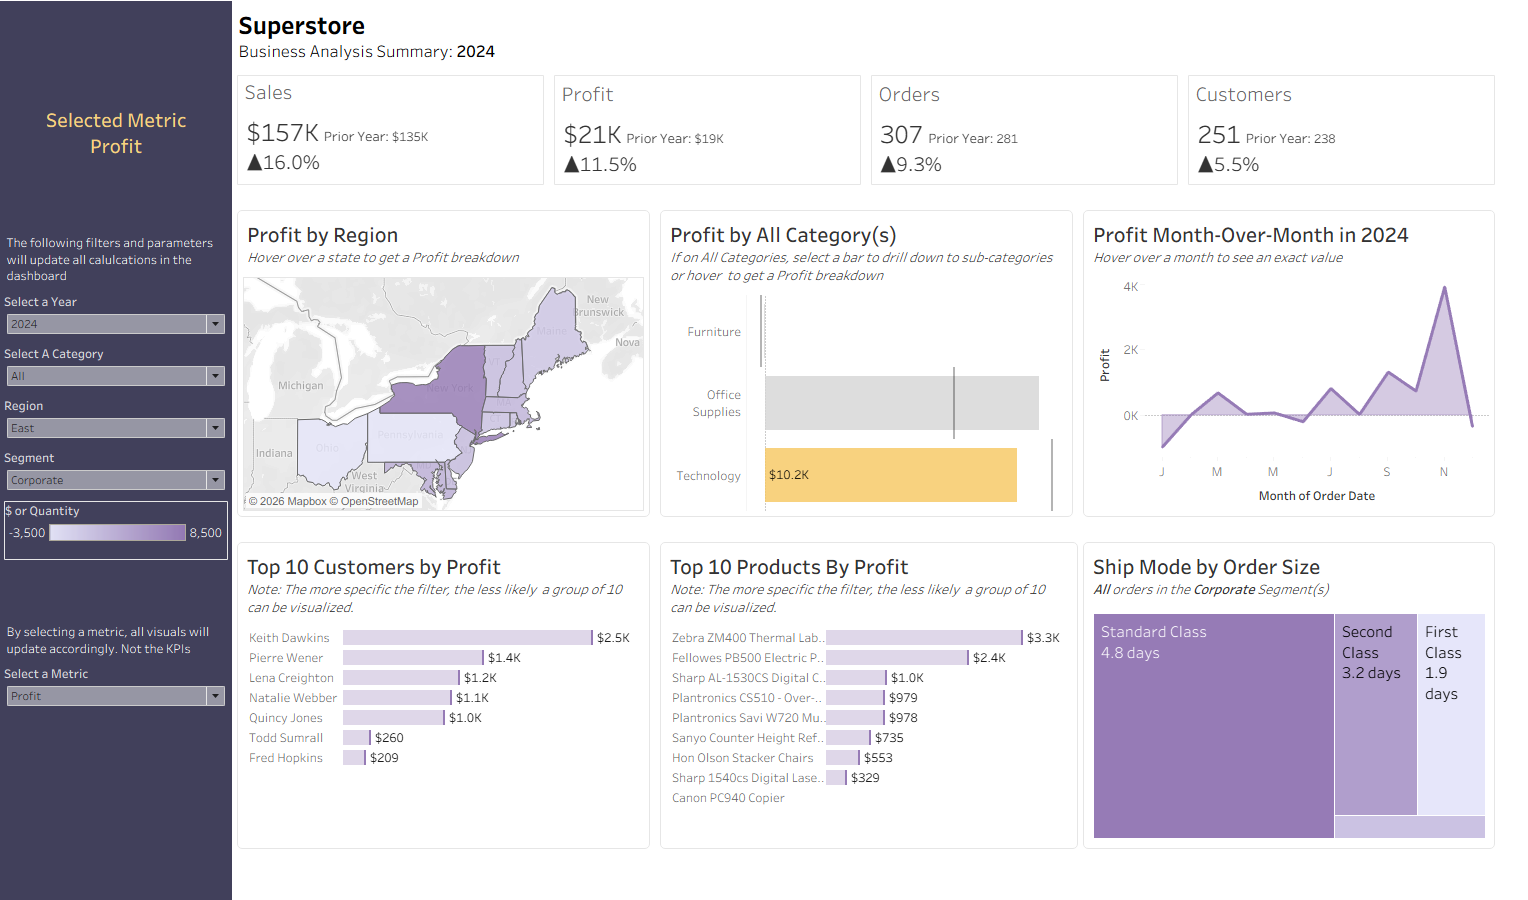
With this view, I can see that
- Office Supplies are the most profitable product among buyers that fall into the corporate segment in the eastern region.
- Towards the end of the year is when we saw the largest spike in profit.
- In New York City, specifically, we saw the highest profit (most likely due to NYC having the largest population out of all the states.
And, if we filter specifically to Office Supplies then the best sellers from most to least profitable are:
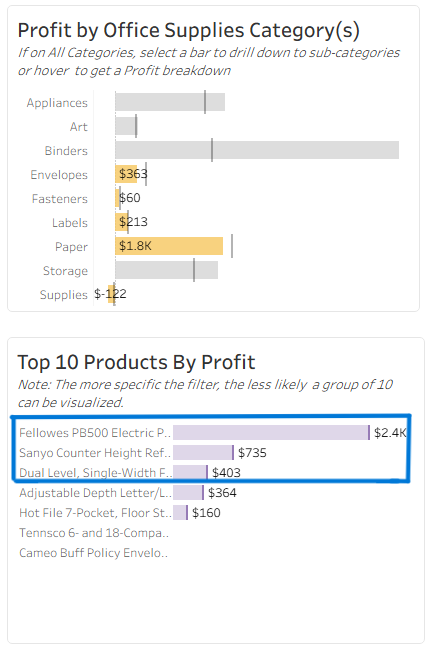
- Fellowes PB500 Electric Punch Plastic Comb Binding Machine with Manual Bind
- Sanyo Counter Height Refrigerator with Crisper
- Dual Level, Single-Width Filing Carts
Now, as a business analyst, I can inform the marketing team exactly which state to target to garner the most profit and which products to advertise, but if we want to be of even more assistance we can provide the names of the most profitable customers. And, they could use their market research tools or data to locate the industries or workplaces of these customers to target specific industries.