


Running calculations are a very useful computation in the data world that have the power to sharpen or nuance your analysis. And, in this blog, I am going to illustrate step-by-step how to create a running calculation in Power BI.
What is a running calculation?
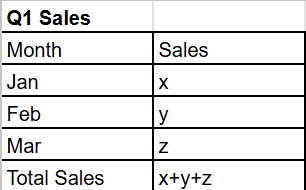
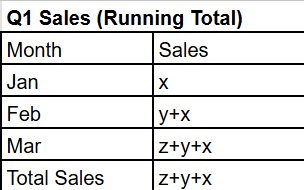
A running calculation is the continuous calculation of a particular value (within a data field) on the basis of the chosen operation (e.g. sum, average, count, etc.). One of the most popular running calculations—that I’ve come across as a data schooler—is a running sum (total). In short, a running total adds the previous value to the subsequent value in your selected field until you reach the set endpoint of your data. If your dataset is live (constantly being updated) then that final row may not be explicitly defined. The diagram below illustrates the difference between a running sum versus a regular sum.
Why is it useful?
A salient use-case for running totals, in the data analytics context, is that you can create visualisations that allow users to compare short term and long term growth.
For example, in the business context, we can compute a running total for sales and a secondary running total for sales on a yearly basis—meaning our running total starts over every year—to compare our sales trends over multiple years to sales in an individual year. Furthermore, we can sharpen our analysis by integrating a sub-category filter to compare the performance of products within a sub-category based on our calculations. See the small multiples below to experiment with the data!
Hold Ctrl to select multiple Sub-Categories
How to calculate a running total?
To compute a running sum in Power BI, we are going to use a DAX function called CALCULATE. This function lets you change which rows that an expression “sees” by adding, replacing or removing filters before the math occurs.
Therefore, to calculate the running sum of sales across our whole dataset, which is 4 years worth of sales, we’ll create a new measure called Total Sales RT.
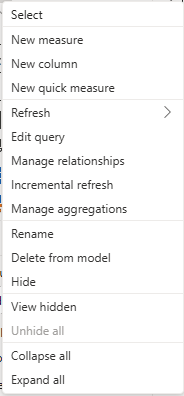

The code we’ll use to create this measure is as follows:

What is happening in this calculation is that we are adding up all the sales, denoted by the measure “Total Sales” (an explicit measure we created earlier, you can read more about explicit measure here). However, within this CALCULATE function we are specifying the manner in which Power BI aggregates the sales values. That last line of code specifies the current point (_date[Date]), then incrementally widens the window, by the subsequent date, to add to our total until we get to our last date or MAX in our dataset.
Lastly, we’ll calculate our yearly running total using a similar process.

The main difference between our first running total and this yearly running total is the last line of code which wraps our MAX(ORDERS[Order Date]) in a year function that, essentially, tells Power BI to restart the running total at the end of every year. Therefore, we can visualize this with the small multiples line chart from earlier!
Running sums are just one type of running calculation, but there are many other operations that we can employ within a running computation to enhance our data analysis. Luckily, we have tools like Power BI to help visualize these computations.