


When you first learn descriptive statistics, standard deviation is often a part of that set of foundational concepts. In my experience, standard deviation was only pertinent come exam time! Whenever the professor showed the curve of exam scores in lecture the next day—if I happened to do poorly—I would check to make sure I was at least one standard deviation within the median. In some cases this meant that a 48/100 would be the equivalent to a C+ (linear algebra was the bane of my existence!).
What is Standard Deviation?
Standard deviation is a value that measures the distance from the mean. So, in other words, if the mean is a definitive center point that most of our data surrounds then the standard deviation is like a unique measuring stick that we create (using our data) to contextualize data points further away from the center. One of the best ways to understand standard deviation is through the normal distribution:
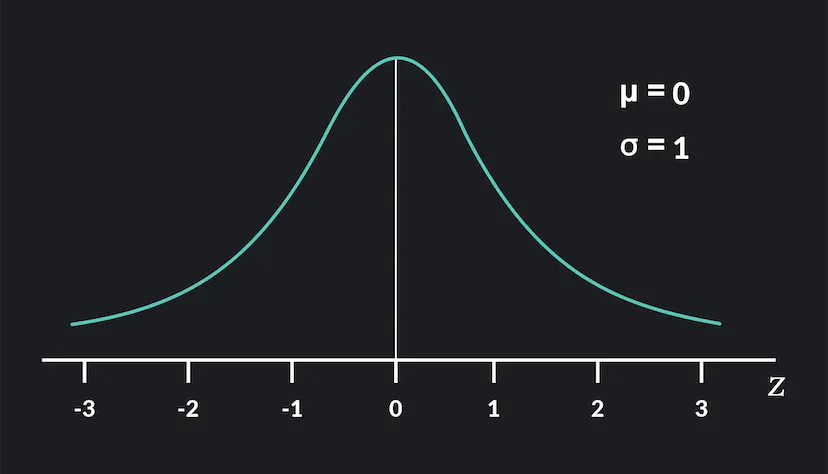
The normal distribution can be very useful when conducting inferential statistics. For the sake of this piece you should remember that 99.7% of data will fall within 3 standard deviations of the mean. If you have points that fall outside that range, it’s an outlier!
How to Calculate Standard Deviation
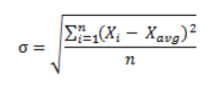
x(i) = the value of your data point
x(avg) = mean
N = total number of data points
In this formula, we are summing the squared differences from the mean, dividing them by the total number of data points and, lastly, taking the square root. In cases where the denominator is n-1. That is the formular for sample standard deviation, we use that when we don't have data for the entire population.
Application: Standard Deviation and Data Analysis
There are tons of different ways that we can apply and visualize standard deviation, but, in this blog post, I will explain two ways this concept can be used in data analysis:
- Spotting Outliers
- Control Charts
Outliers
Similar to the word ‘theory’, the term ‘outliers’ is a pretty popular colloquial term used to describe things or people that aren’t similar to the rest. However, this term is grounded in statistics! Since standard deviation is a way to measure a distance from the mean, we can use standard deviations as an increment to, essentially, expand our ‘breadth of inclusivity’. And, if we remember our rule from earlier that, generally, 99.7% of our data will fall within 3 standard deviations of the mean. We can definitively identify outliers. So, standard deviation gives us a mathematically grounded rule for spotting outliers!
Control Charts
Control Charts are another great application of standard deviation. An example of a control chart I built for a Workout Wednesday can be seen below!
(If you want to learn how to build control charts check out this post from my DSNY 13 peer)
These charts are similar to box-and-whisker plots because the upper and lower control bounds define the range of values that the user is expected to find in the data. The main difference between control charts and box and whisker plots is that control charts are better for visualizing data over time. These charts are great for determining the efficacy or efficiency of processes. If the mean describes the intended or typical output of a process in the form of a numerical value then the data analyst can use standard deviation to define the upper and lower bounds, therefore, the range of other values that are appropriate for qualifying the control of the observed process. Which means outliers can be defined as out of control lol!