


For the final day of the capstone project, I spent virtually the entire time formatting my dashboard and developing my story for the presentation. As I began formatting my dashboard I immediately decided to deviate from my sketch because the view started to get too busy. Below you can see how my vision in the initial sketch differs from the final product.
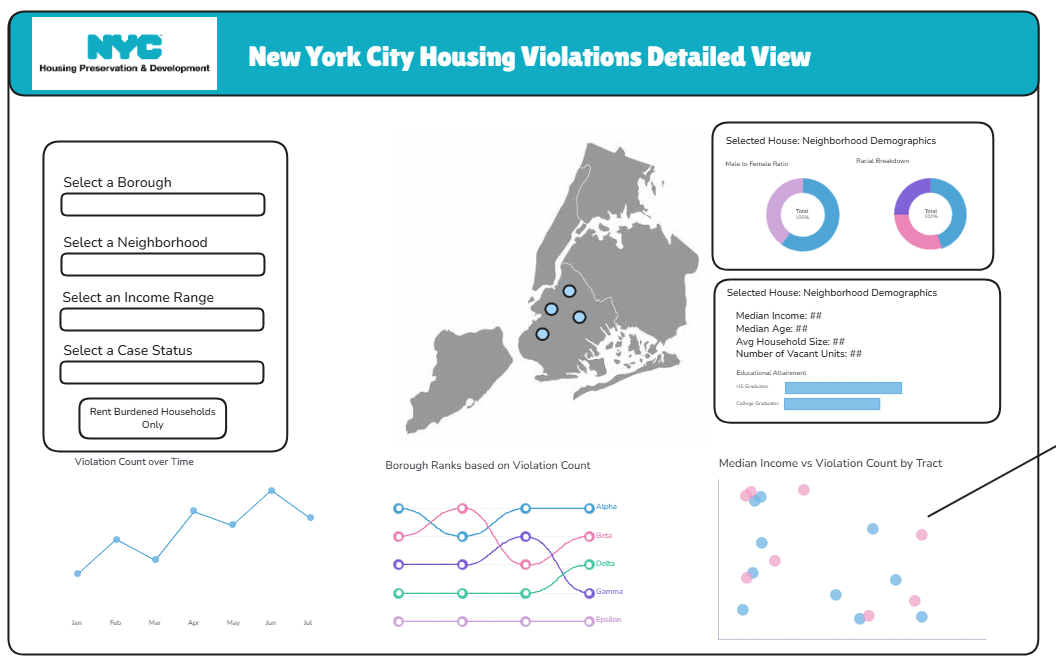
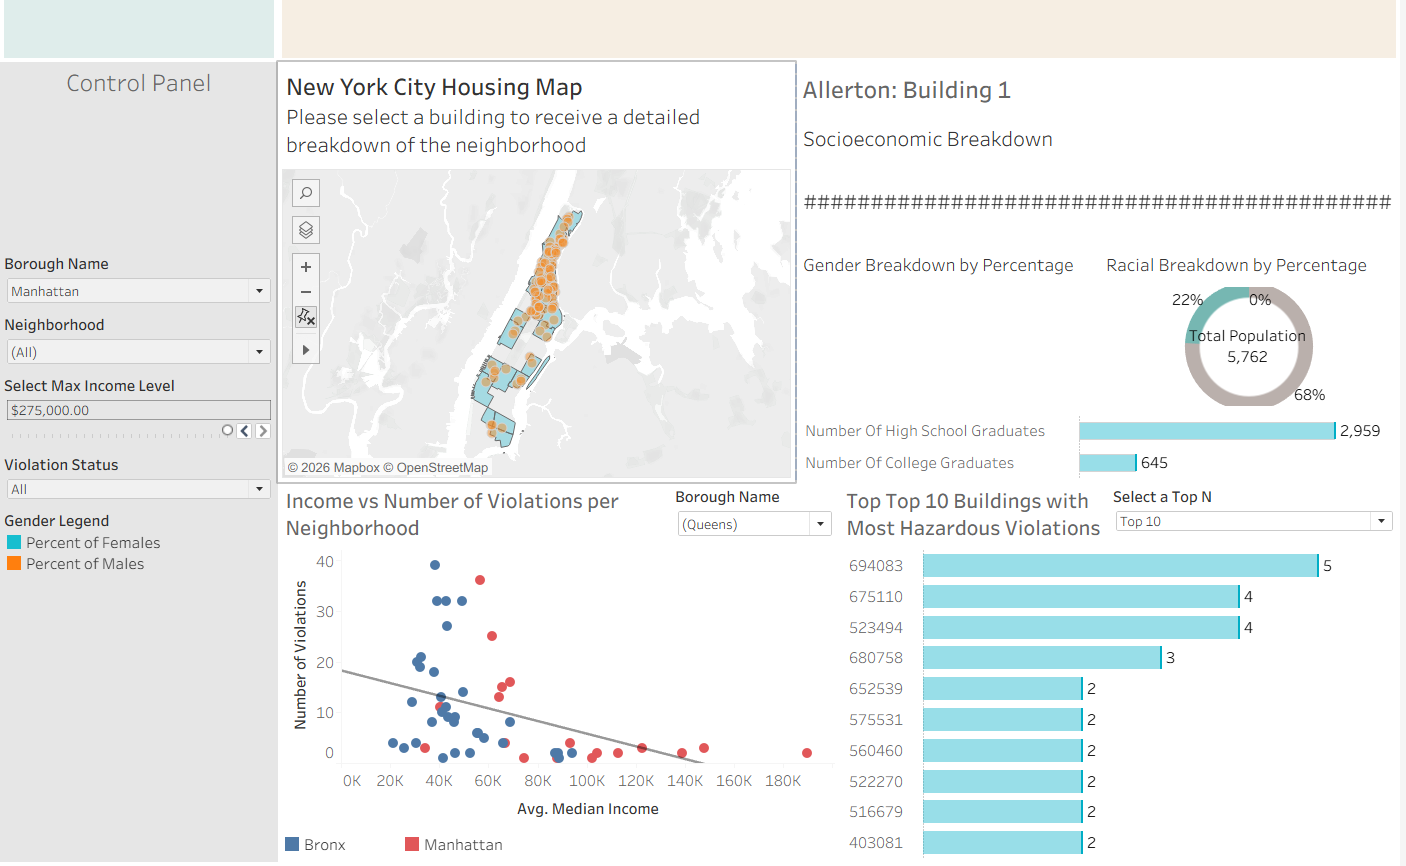
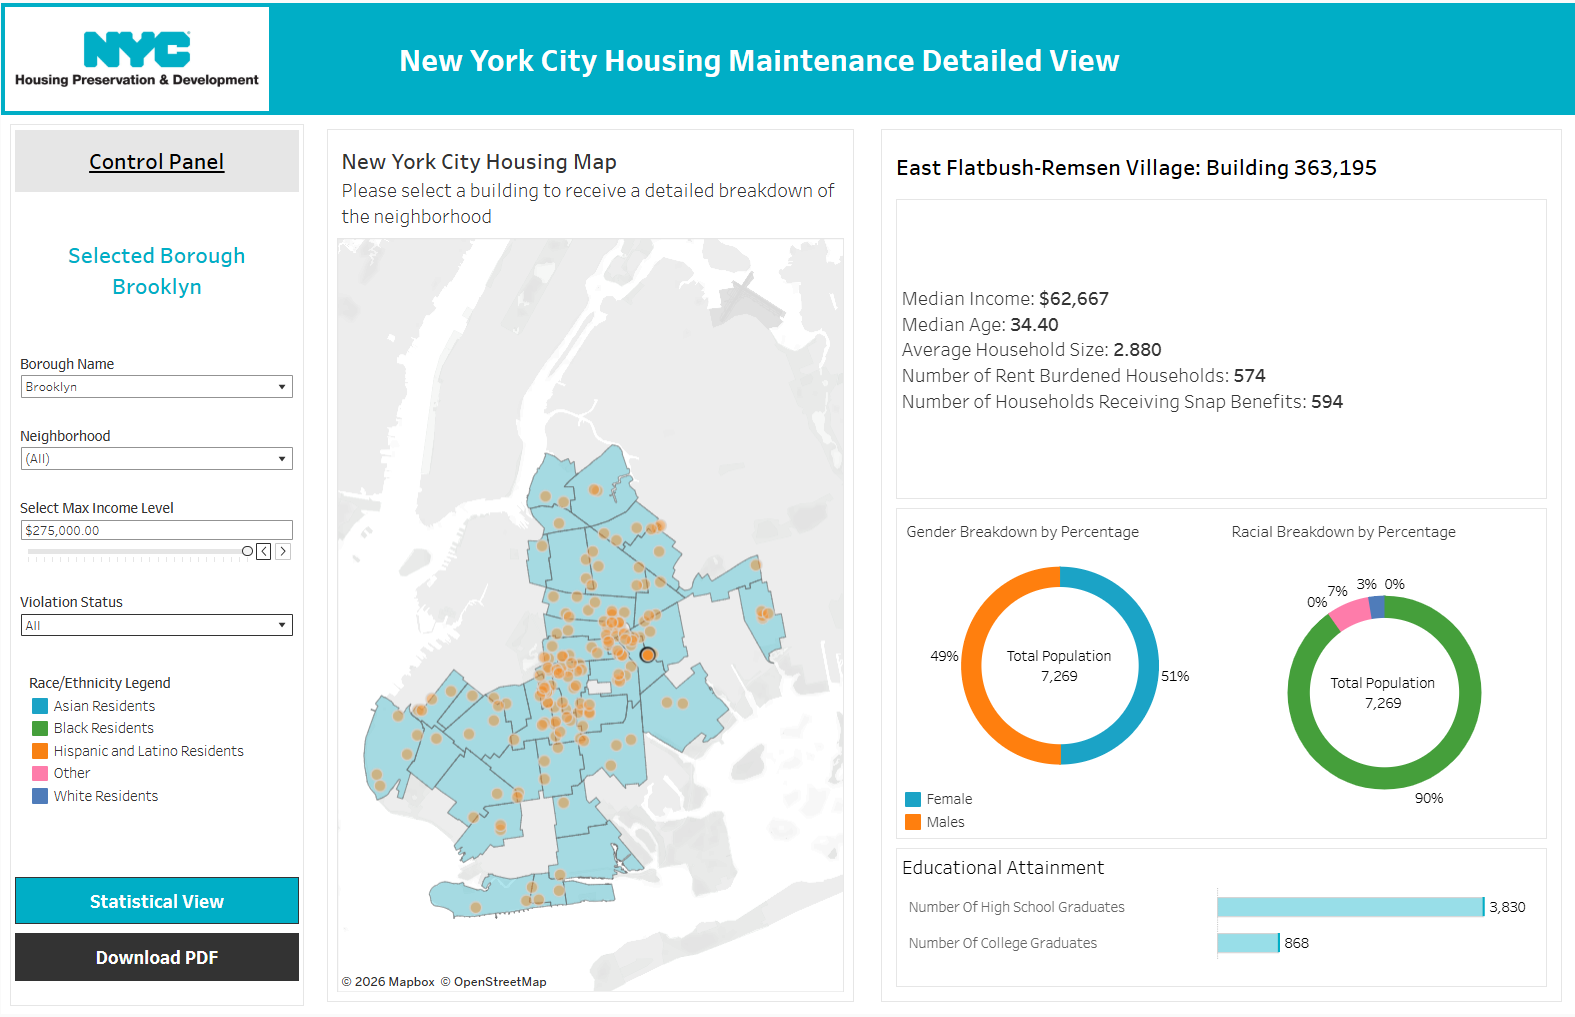
Even when I switched from having three charts below my map and DZV containers to just two, the view overall still seemed overwhelming. This would make it difficult for, even an analyst, to derive useful insights about housing code violations. Thus, my solution was to split my analyst dashboard into two views. The first one focuses on the map specifically so that the analyst can get building level detail and obtain a broader understanding of the neighborhood overall so that resource distribution for housing maintenance is equitable.
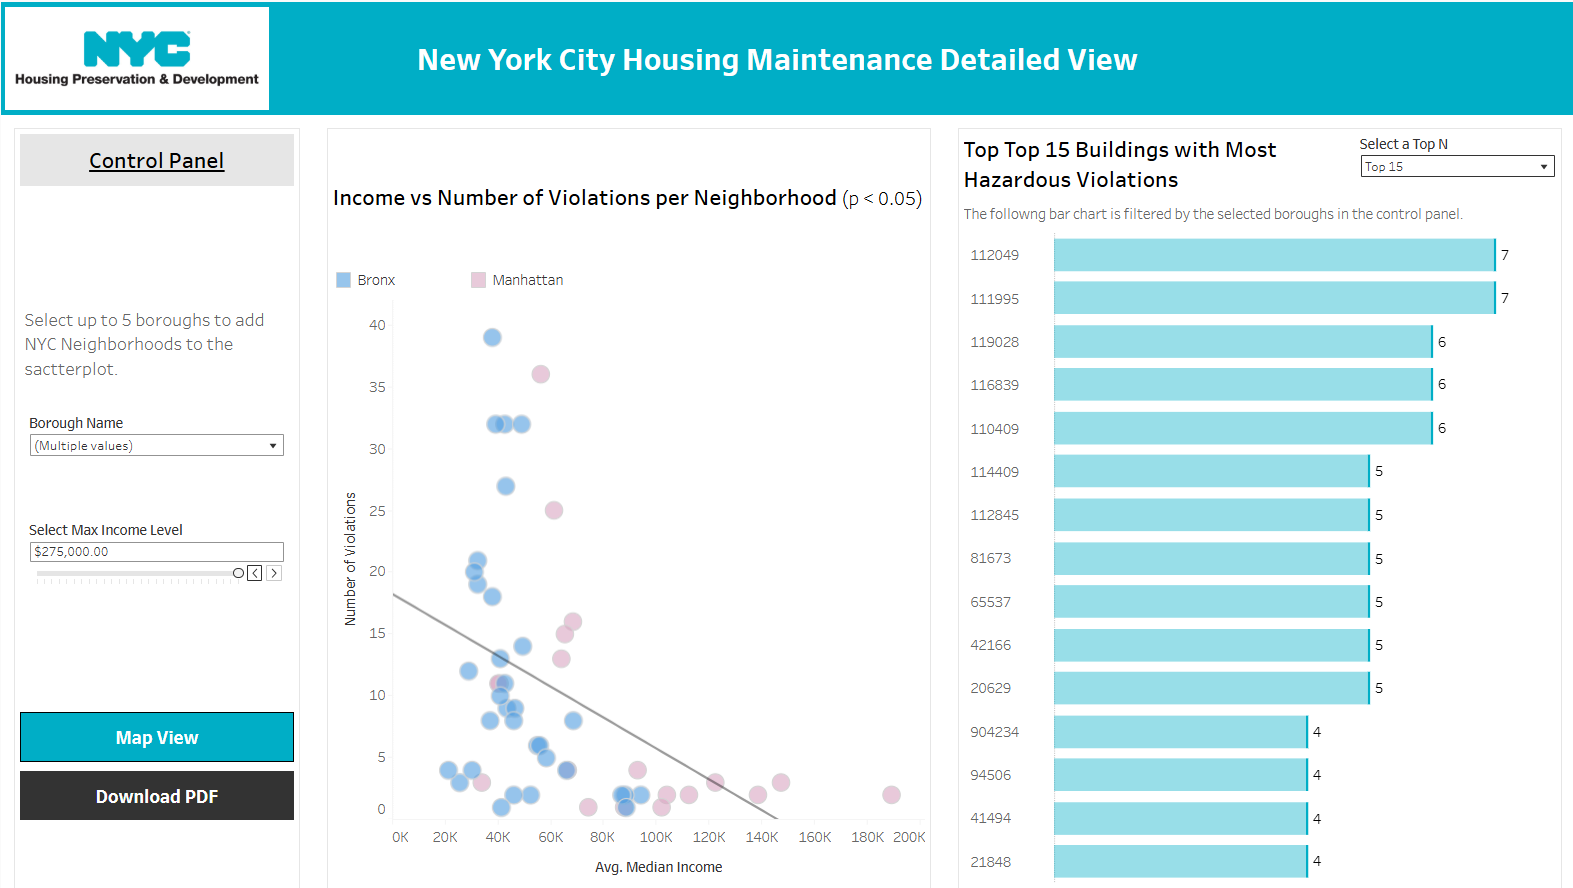
The second view is more of a high level view that allows the analyst to conduct more statistical analysis and measure the severity of violations across boroughs. Altogether, the two visualizations work together to provide a stronger quantitative argument for the NYC HDP as they develop housing policy that strategically targets New York City slumlords and people within the New York City Housing Authority that have let certain public housing buildings descend into squalor.
Altogether, this was a very fun project that gave me alarming insights into the state of New York Housing Maintenance and I am excited to continue developing my dashboards so that they can be useful to the people of New York City at some point too.