For our final week of training, DS28 have dashboard week, where each day, we build a dashboard based on data selected by the coaches. For Day 1, we were asked to build a dashboard based on the New Orleans Police Bodycam Data
More details on the task here: https://www.thedataschool.co.uk/andy-kriebel/ds28-day-1
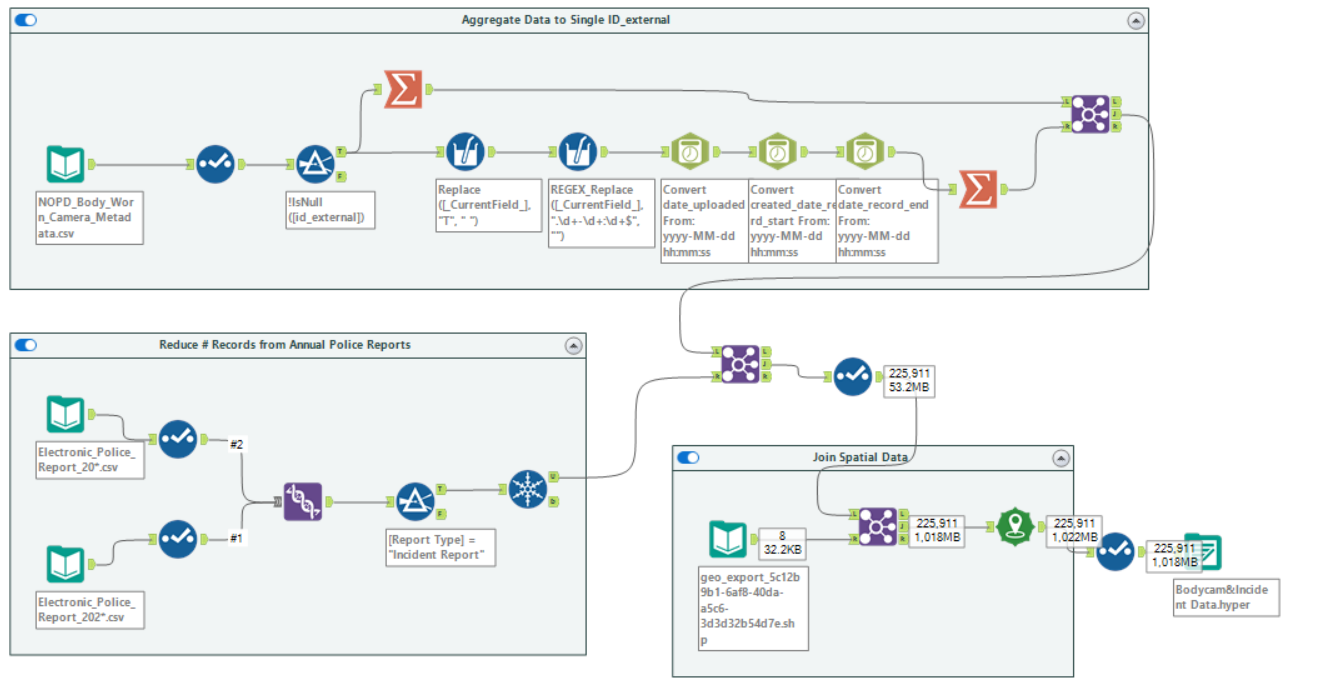
The bodycam data itself is quite limited in detail, so to build a dashboard with some sort of analysis required me to join in additional data. I chose to include annual police reports so that I could link the bodycam data with the incident types (e.g. Assault, Theft etc...)
I also joined on spatial data for the police districts so we could have a visual breakdown by district
Here's a snapshot of my Alteryx flow.

Most of this flow involved reducing the number of rows by aggregating the data to a single incident (there may be multiple bodycam recordings for a single incident). Ultimately I brought 4 million rows down to about 200 thousand rows.
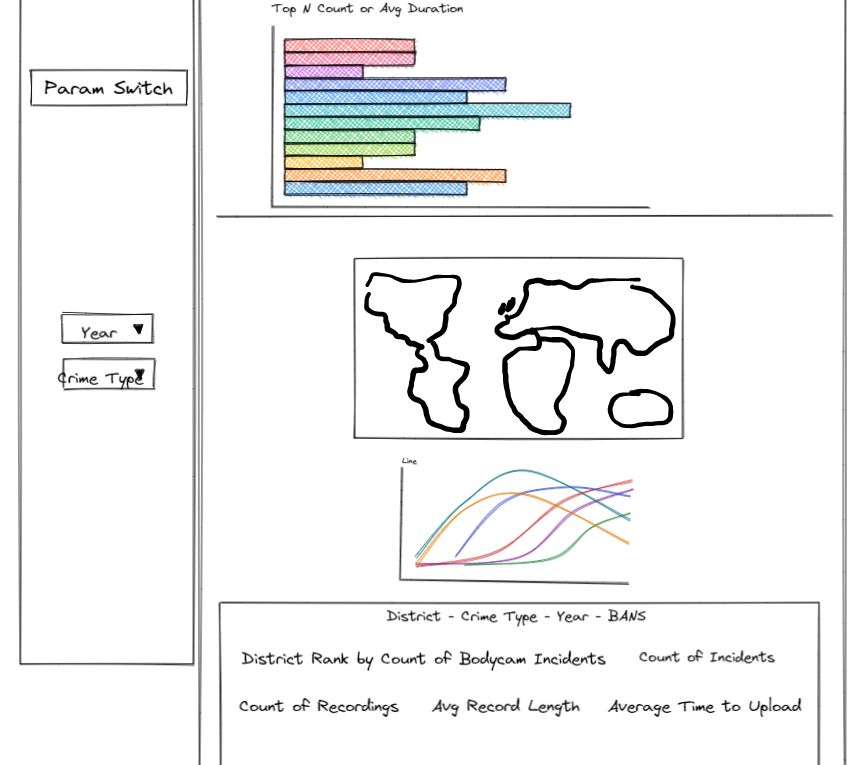
Here is my initial plan for my dashboard:

The planning was key as it helped direct the data I needed for my dashboard and kept me on track.
You can see that I had planned for a map, a barchart showing the top N incident types by recording duration, a line chart and some BANS
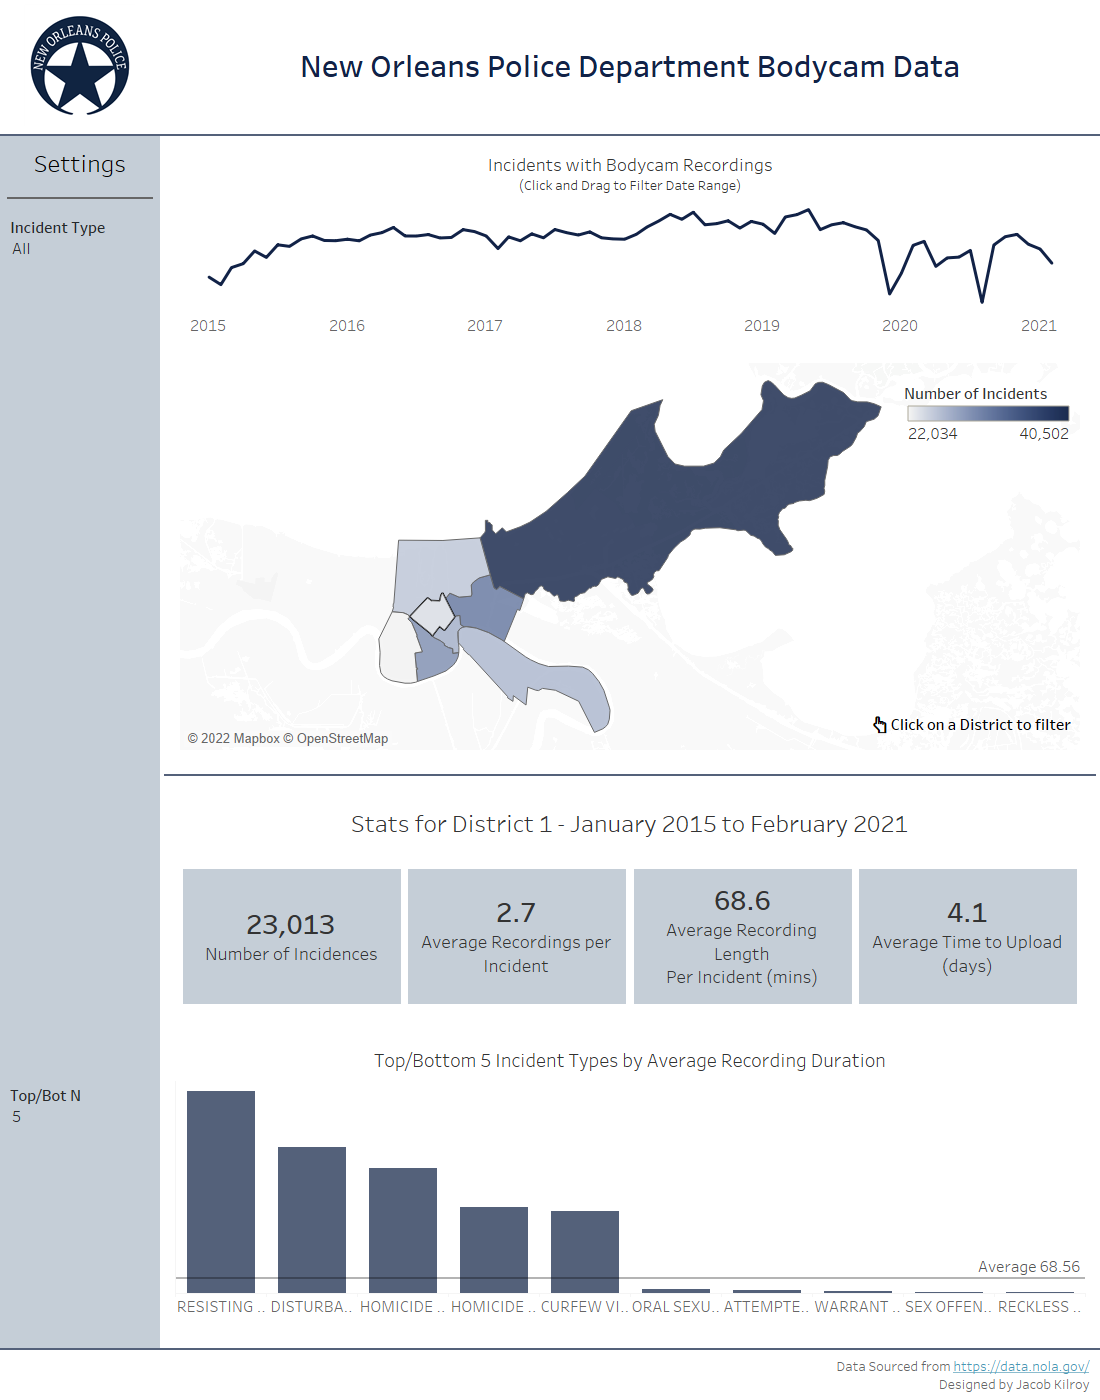
For the most part, my dashboard followed the plan, with some slight deviations in the order.
Overall the data was fairly straightforward, although quite limited, which meant that in depth analysis was quite hard.
Here is my final dashboard:

If I was to build on this dashboard further, it would be to build on the BANs so that you can compare previous periods - with the way I did the date range filter, I didn't have the time to build the dynamic date range but definitely would be a task worth doing.
I could have also maybe taken a risk with a bolder 'dark' theme but I played it safe as dark background can be difficult to work with.
