


T-Tests are a valuable analytical tool for evaluating whether differences in averages are meaningful or just the result of random noise. The framework involves calculating a test statistic based on the average and spread of the two groups, then plotting that test statistic on the standard normal distribution (feel free to disregard the math).
Unfortunately, the T-Test process has been limited in Tableau to this point. The calculations necessary to obtain a Z-Score or T-Score are all present, but converting those test statistics into p-values is not a native feature of the software. Users (including myself) often use the "Empirical rule", which states that approximately 68% of the distribution falls within 1 standard deviation of the average, 95% of the distribution falls within 2 standard deviations, and 99% of the distribution falls within 3 standard deviations.
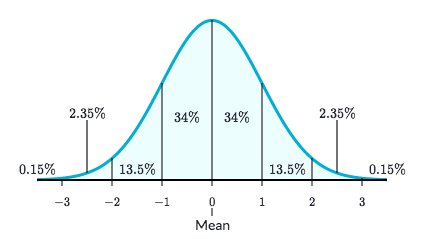
This "rule" is most often applied to test p-values against the common statistical threshold of significance of 0.05. If the observed test statistic is more than 2 standard deviations away from the mean, the area beyond that point is determined to be less than 0.05, making the test result significant.
This rule is useful, but restrictive to a binary outcome – pass or fail! In practice, different businesses have varying levels of risk tolerance and acceptance. For a low stakes situation, a p-value of 0.10 might suffice. When it comes to life-saving medical treatments, a p-value of 0.01 or even 0.001 might be necessary to make a safe conclusion.
To find our solution, we have to take a brief step into the world of mathematics. In their 2009 paper "A Logistic Approximation to The Cumulative Normal Distribution", Bowling, Khasawneh, Kaewkuekool, and Cho proposed an equation that would return the area to the left of the standard normal distribution given a test statistic. For example, if we fed 2 into this equation, we would return 0.95, since according to the "Empirical Rule" 95% is to the left and 5% is to the right of this point. Here is the equation:
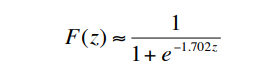
It is important to know that this is still not a perfect approximation, and will still have small amounts of error. According to the paper, the maximum possible deviation is 0.0095, so we can guarantee that there cannot be error greater than 0.001. Knowing this, thresholds for significance can be slightly moved (from 0.05 to 0.049) to account for the additional possibility of very small error.
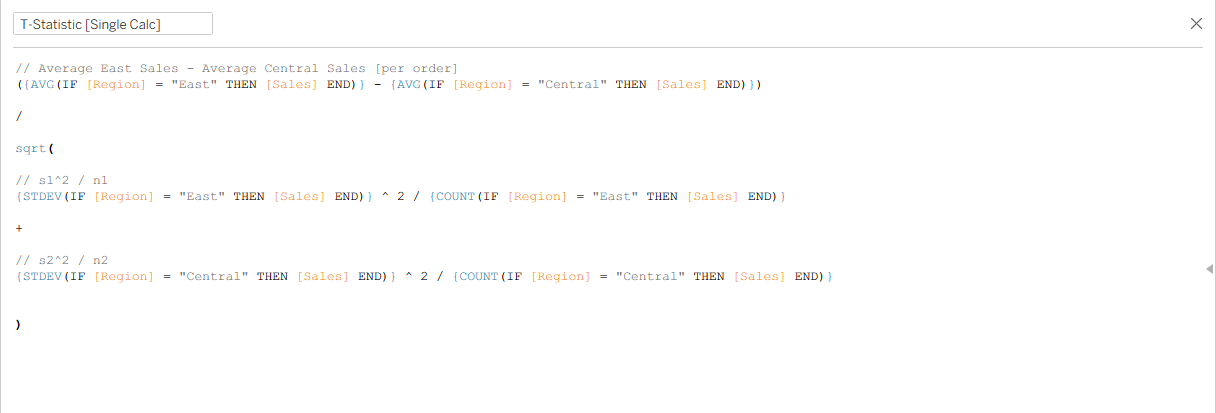
This is the golden equation to Tableau implementation! To get us to this stage in Tableau, I'll also walk through the previous step. For this application, our question of interest is the following: are average sales per order different between the East and Central regions? This example will use the Sample - Superstore dataset built into Tableau.
The T-Statistic Calculation is shown below, which has the difference in means as the numerator, and a measure of spread in the denominator (balancing the spread of the two groups considering their sample sizes).
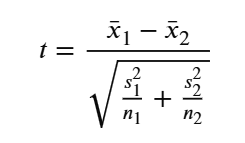
In Tableau, this looks like:
At last, we can use this T-Statistic to get a p-value:
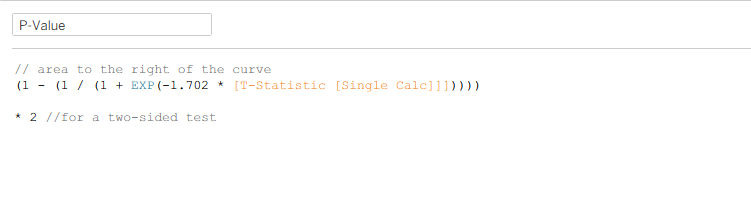
In this case, I chose to double the p-value to conduct a two-sided t-test, which does not make a base assumption about which group might be the larger one (therefore making it more difficult to conclude significance).
Our final product in Tableau product is:
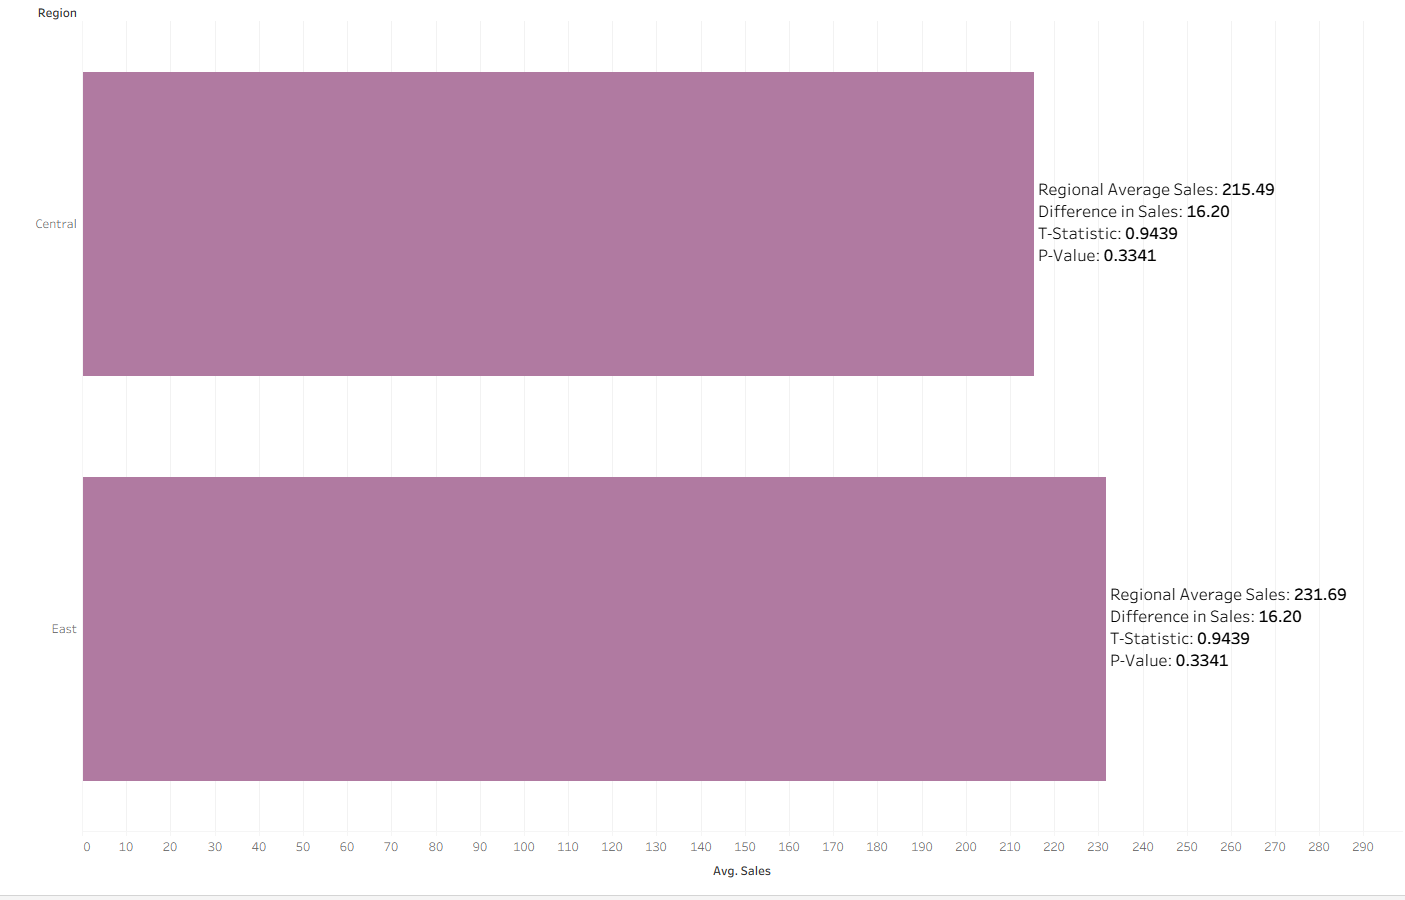
We cannot conclude that there is a difference in average sales per order across regions since the p-value is too high even for the 0.15 threshold stated before.
One important note is that the standard normal distribution is the distribution used for a Z-Test; however, when the sample size is greater than 30, which certainly applies in this case, the T-Distribution becomes close enough that the difference is tiny.