


When looking at a distribution in a dataset, variance is a key feature. It shows the 'spread' of a distribution, with higher variance representing an increased likelihood of values that are further from the mean. In the case of the normal distribution, the variance is squared standard deviation (σ^2).
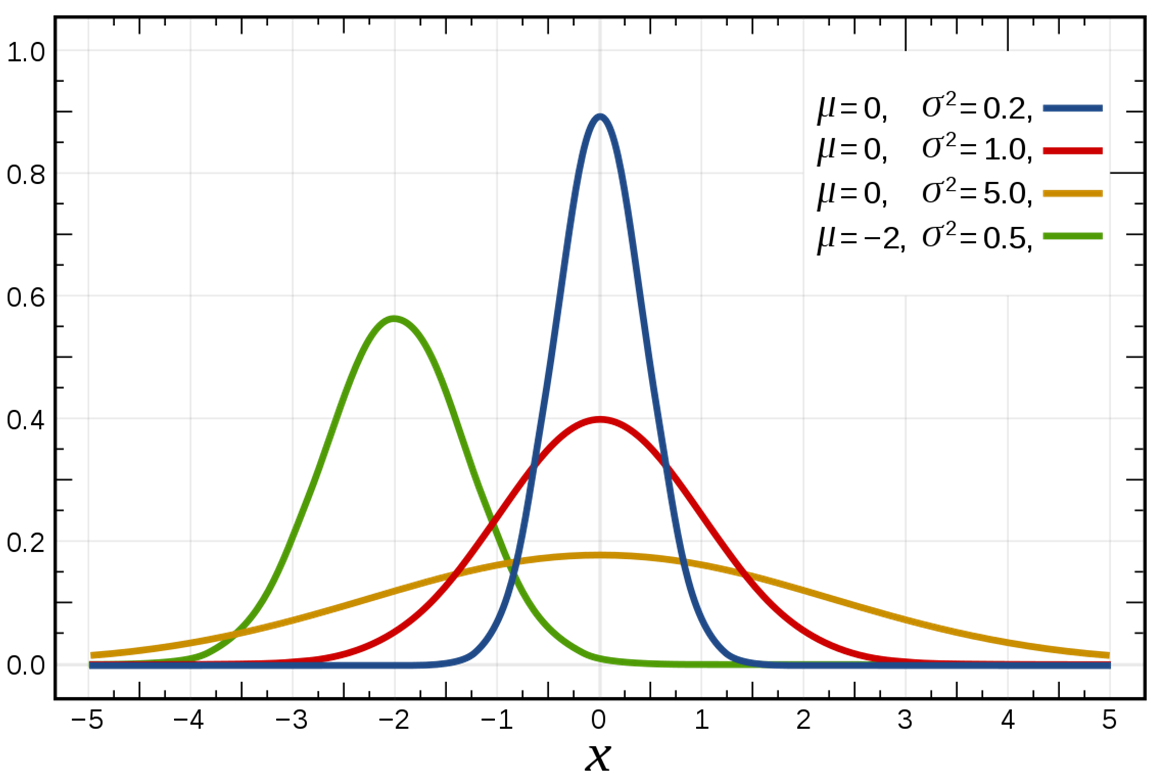
This simple measure is useful, alongside the mean, of quickly describing the properties of any normally-distributed distribution. However, it is not just one measure.
The population variance refers to the variance of all datapoints. This can be used in the case where the data is available for the whole population under consideration. It can found by adding together the square difference between each value and the average, before dividing it by the total number of observations.
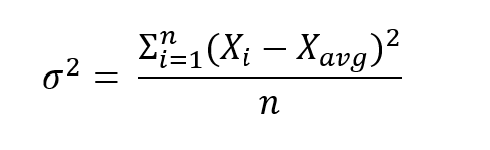
For example, if you are examining the exam results of a class, and everyone's results are available for analysis, then you can use the population variance. However, if you were looking across students in separate classes in the same school-year, but you only had data on a few students in each class, you would need to consider the sample variance.
The sample variance refers to the variance of a given sample of data, which doesn't include the whole population. By using the sample variance, we can account for the fact that samples regularly underestimate parameters like variance (links below for more info).
As above, it can found by adding together the square difference between each value and the average. Contrary to the population variance, this is divided by the number of observations minus 1, which slightly raises the value of the sample variance and eliminates the bias.
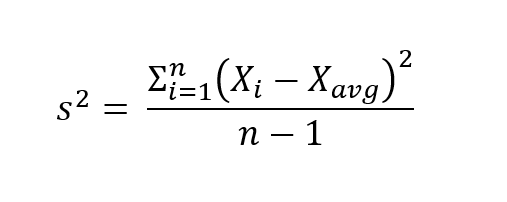
In terms of formulae, the numerator of both measures is the same, with different denominators. The sample variance has a denominator of n-1, whereas the population variance has a denominator of n. If you'd like to know why this is the case mathematically, take a look at Bessel's correction, which further explores the reasons why sampling can over-estimate the variance (and other values).
It is worth noting that, while the sample mean does eliminate bias in variance, it will not do so in the standard deviation. It will also often lead to an increase in mean square error (MSE), which is further explored in the article linked above.