On the fourth day of dashboard week, we were offered the chance to examine some of the tableau accelerators. These are dashboard, designed for specific industries and purposes, which act as a useful basis for design and a starting point for what structure of data could be required.
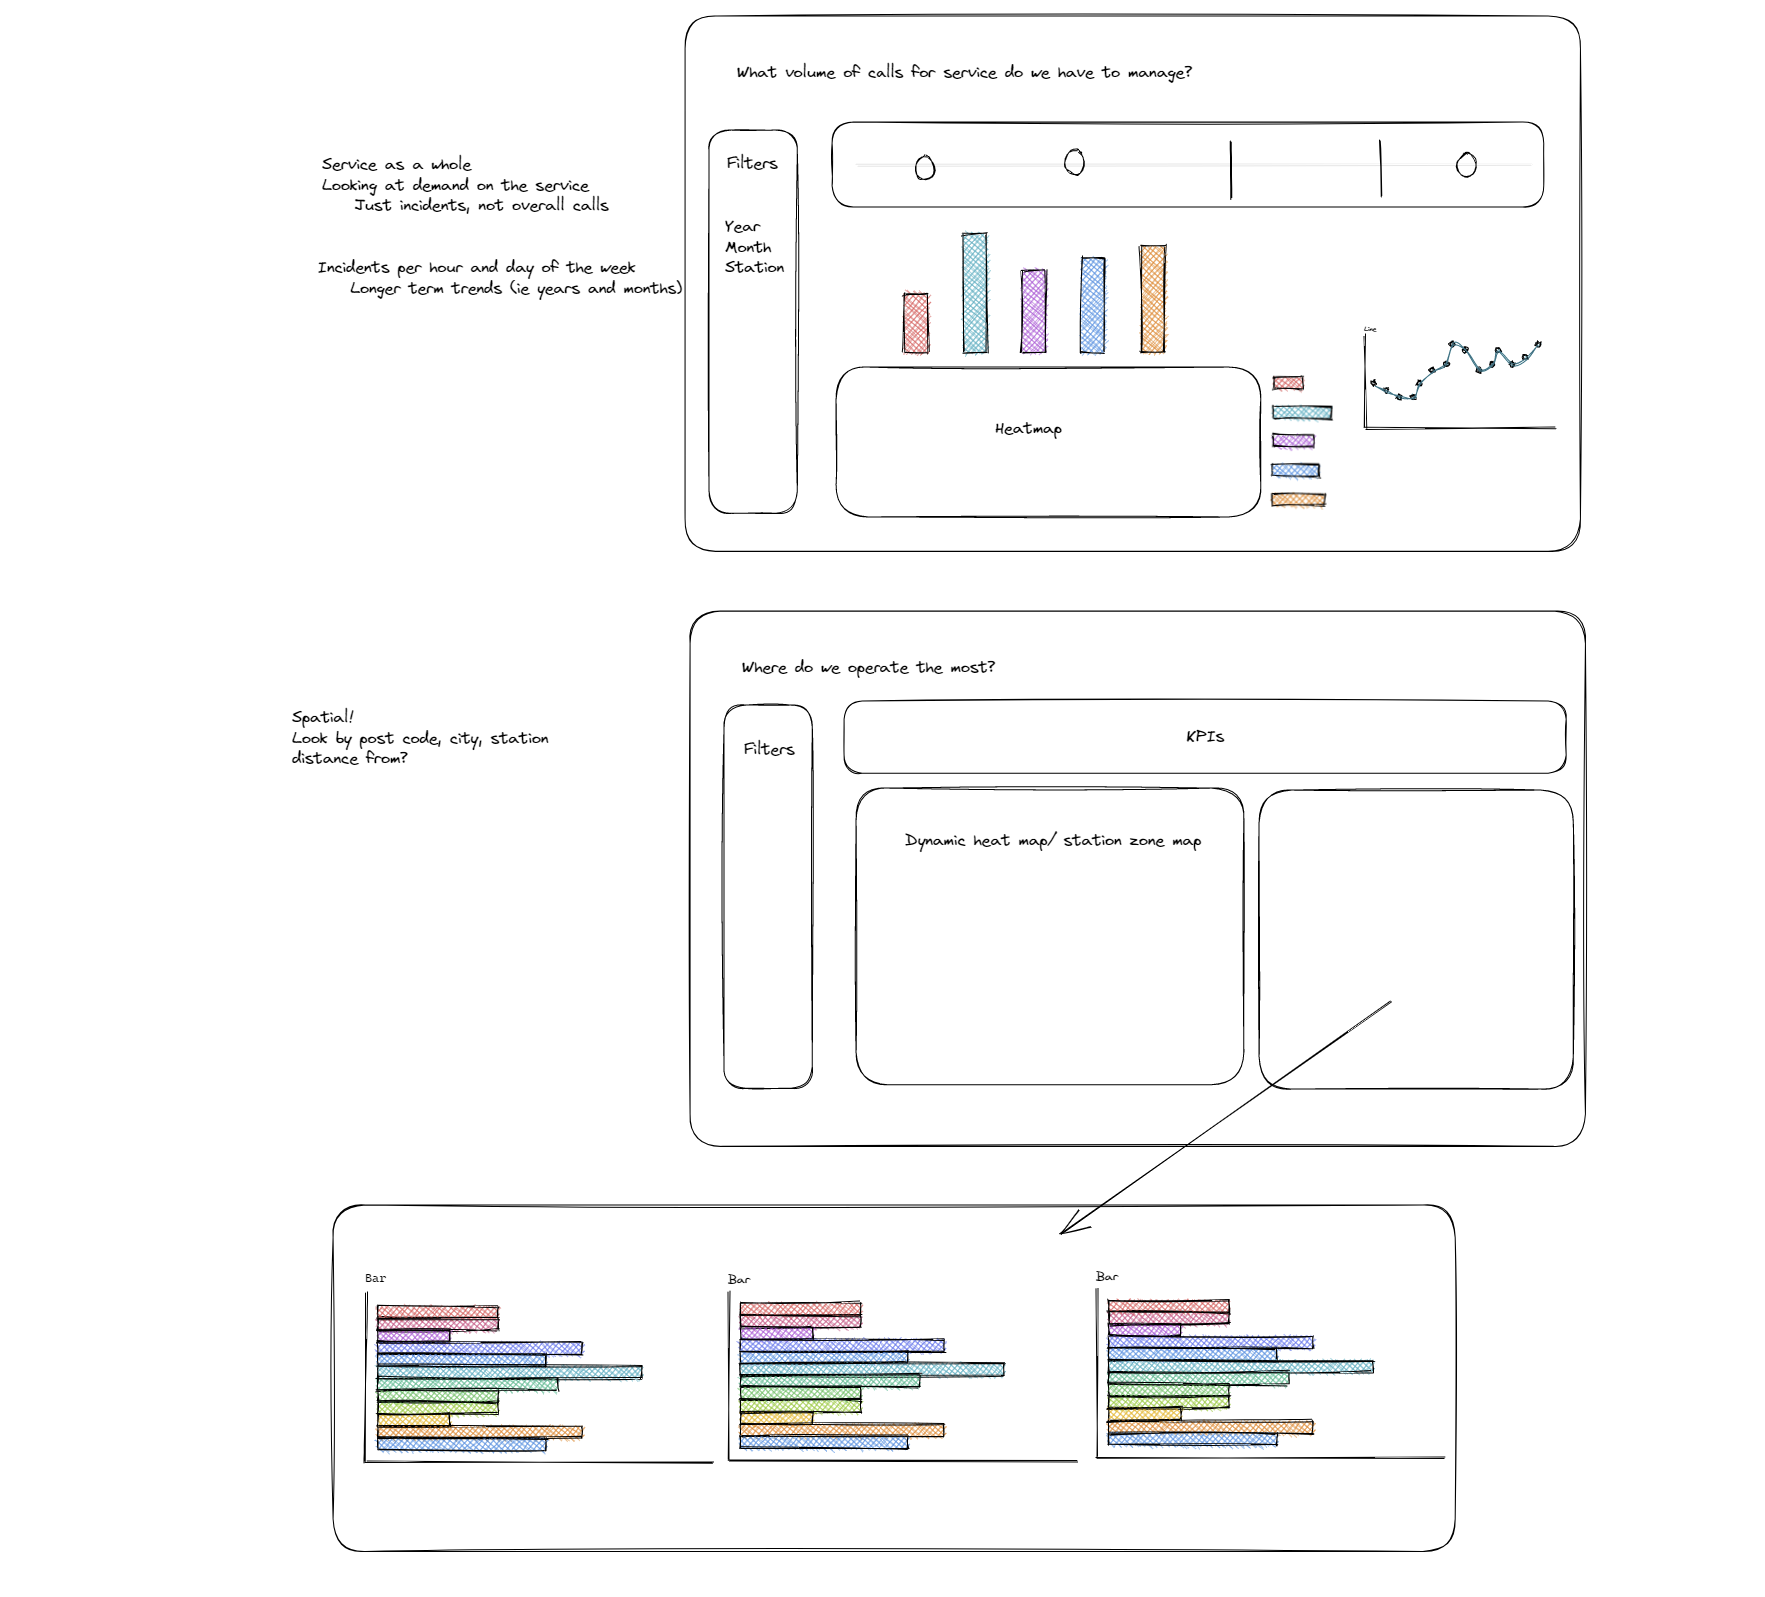
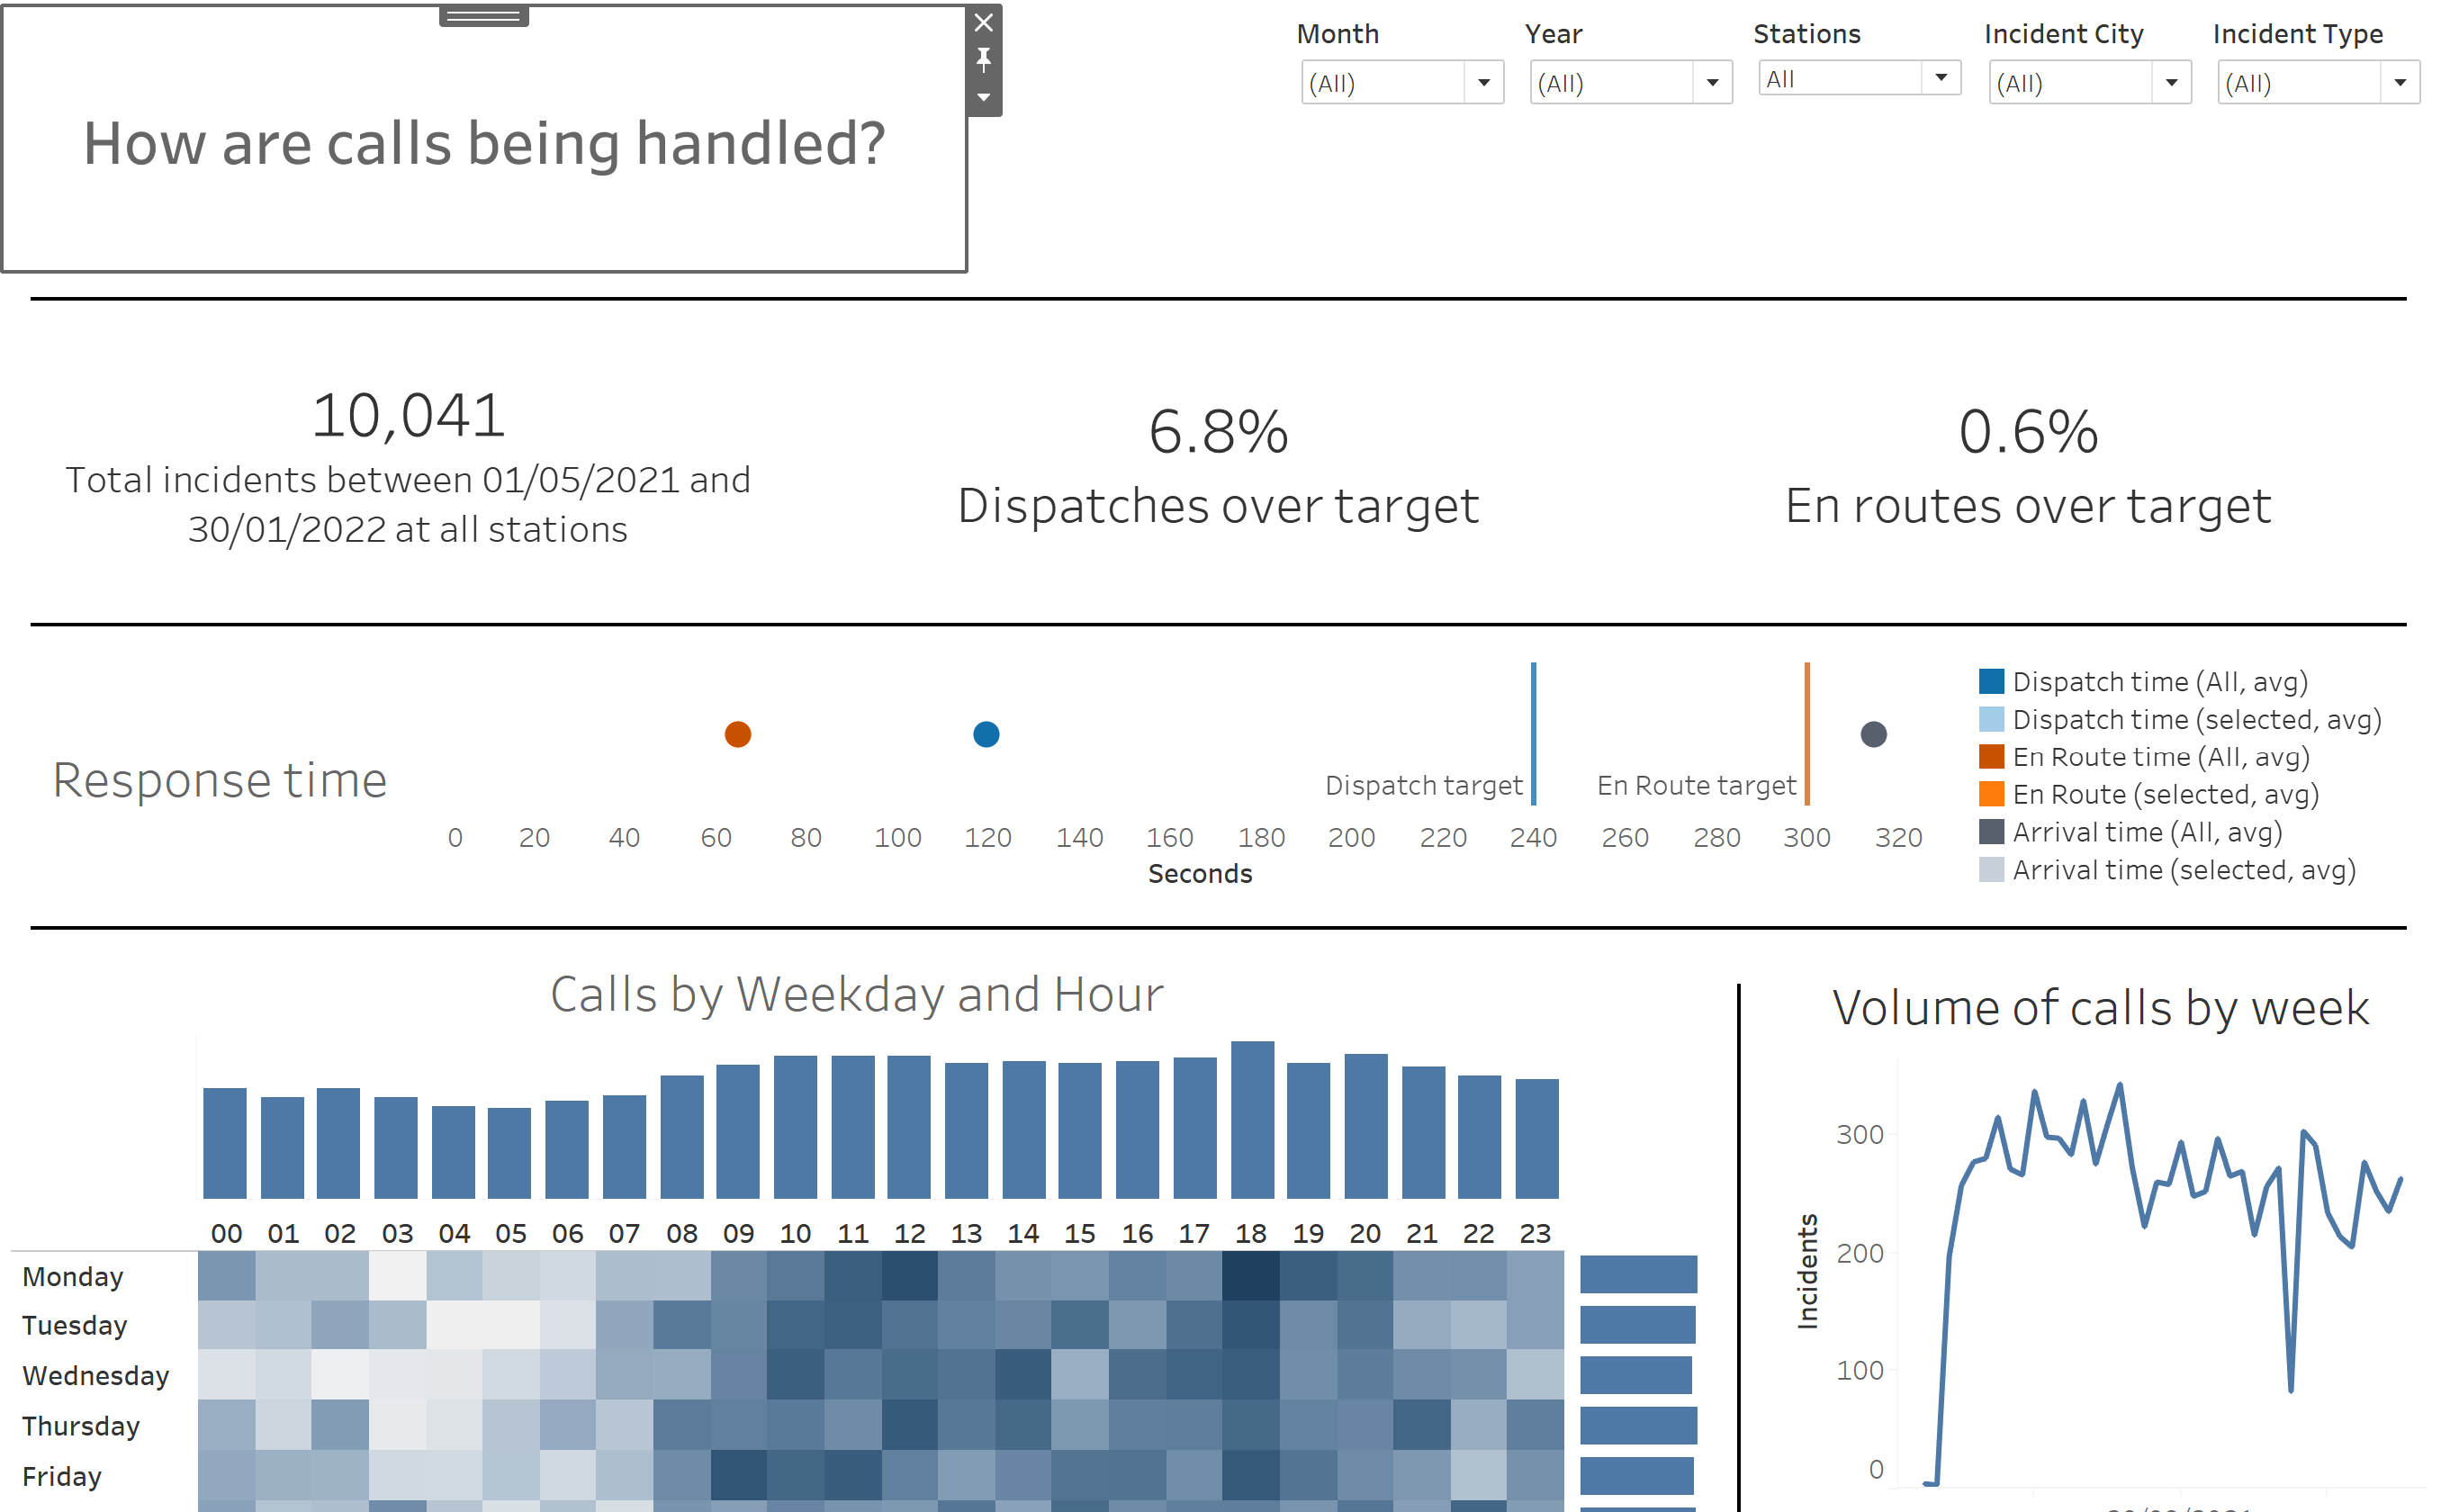
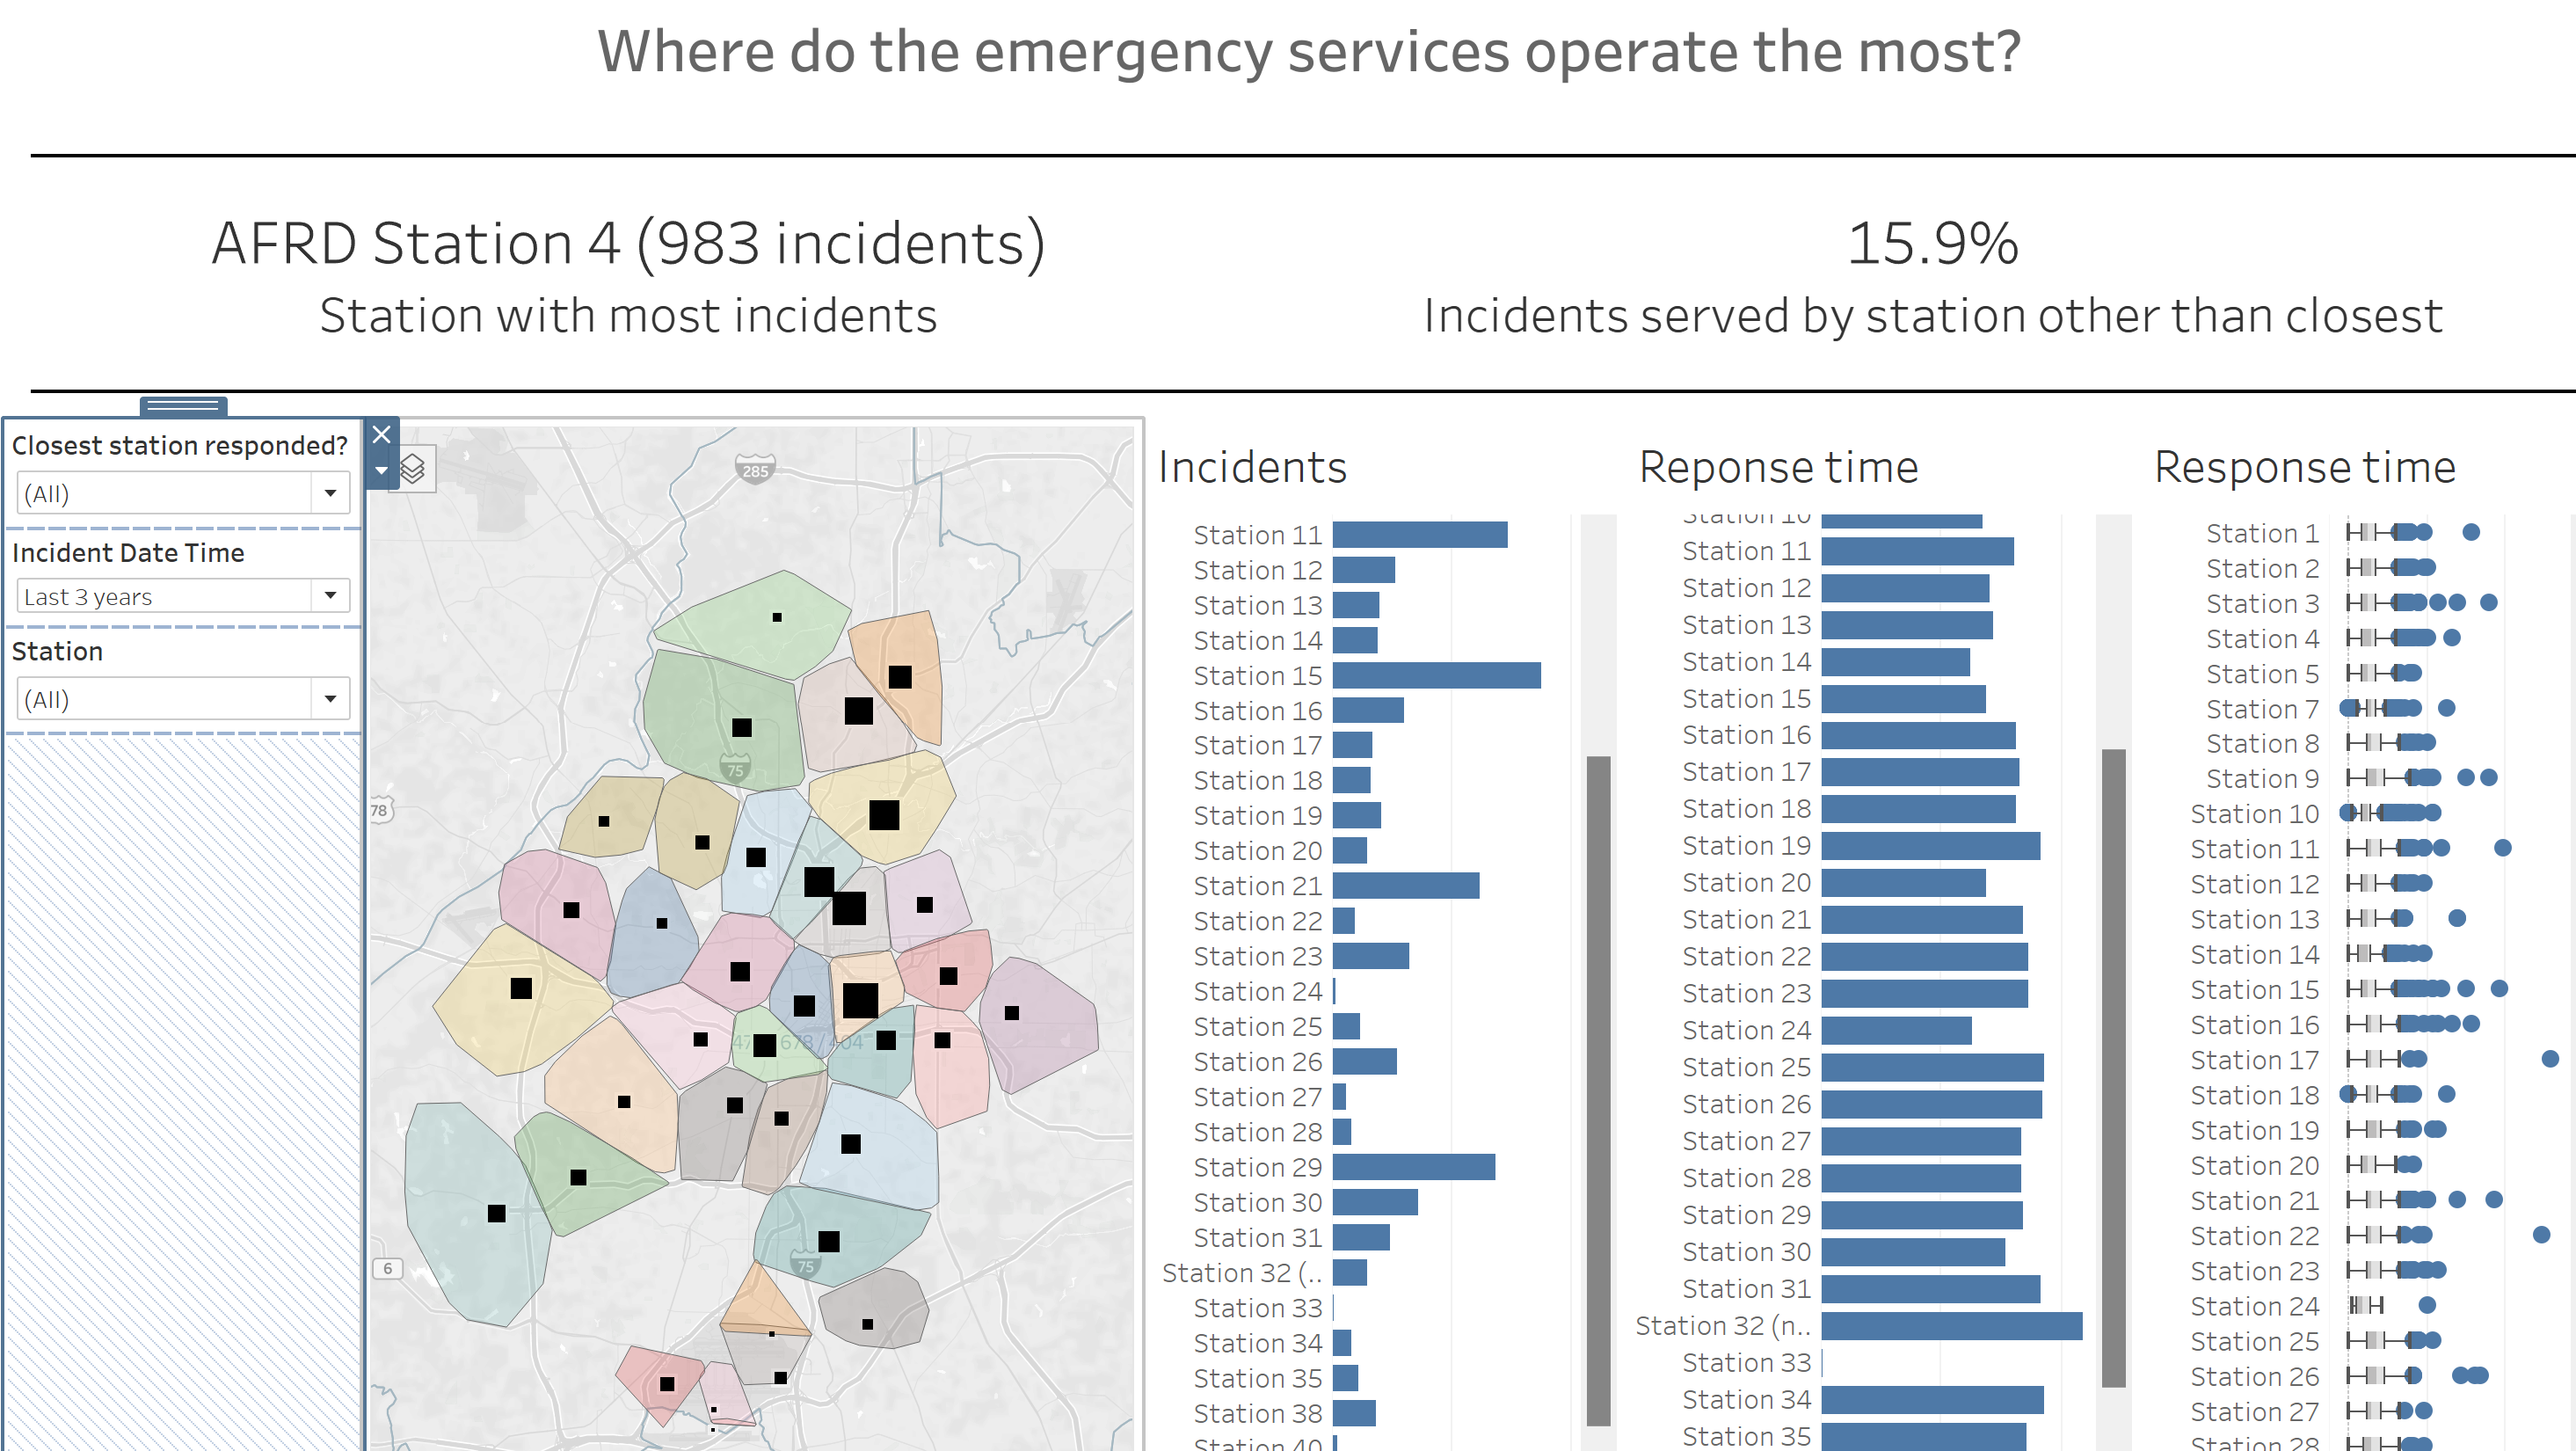
In my case, it was a dashboard centered on the responses by emergency services to calls (https://exchange.tableau.com/en-gb/products/655). I quickly narrowed down my task to two core questions, regarding the volume of calls and the locations of specific incidents. I designed my dashboard, and considered what I could answer with the given data.

Firstly, a lot of the spatial data was not present in the dataworld dataset, as it had been converted into csv and xlsx. To rectify this, I recovered the data from the demo dashboard, which was available to download and matched the dataworld data in all other aspects.
Once this had been achieved, I got into a good rhythm of work. I successfully make zones to mark the closest station to any given incident, and structured my dashboard to try and answer the question, reflecting the KPIs that were outlined in the task.


After examining the data, I had a few questions to expand on:
- Are there multiple calls for an incident? I presume if there's a fire more than one person might try to get help.
- Is there more specific data about the timeline between a call being made and a fire being attended? I became a bit confused as to the difference between first call and dispatch.
- How are incident times determined? I would be interested to see how long it takes for someone to be called (significantly hard to measure)
- Is arrival time correlated to weather/traffic/city events?
- Urban/Rural divide - do those in the city get a better or worse response?
- Do services from beyond this dataset also respond to fires?
- Are there more vehicle fires along the highways?
- Movement between incidents - do the emergency services always return to their station, or can they respond from the field?
- The incident description - would have been fascinating to extract key words (accident, false alarm, faulty etc)
Overall it's been a challenging day, with the need to limit my ambitions to adequately answer some of the questions. I'm proud of the project I've produced, but I suspect I would have been better served by answering one question well, rather than trying to answer all the questions.
