


Today, we learn about Power BI.
The task is to pick an industry and use Mockaroo to create a data set with the industry of our choice. Then create a KPI dashboard using Power BI. For the Mackaroo data there are a few boxes we had to check:
Data MUST include:
- Time series
- At least 3 dimensions; e.g., products, suppliers, etc.
- Geographical data
- At least 4 measures; e.g., sales, profit, targets, etc.
- Demographic data about customers (so there must be customers in the data set)
- Anything else they wish to include in their dataset
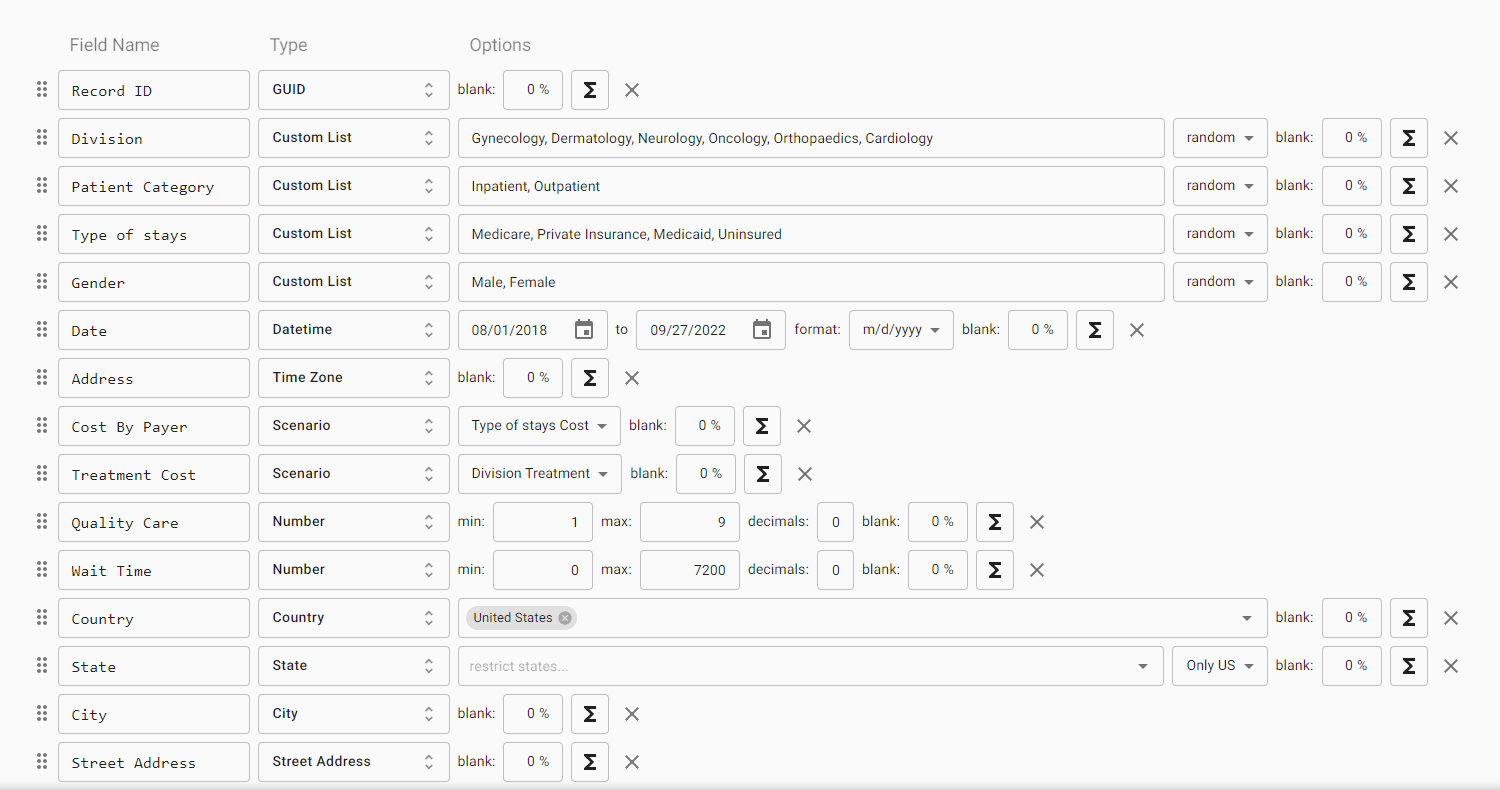
This is what the data looks like in Mackaroo:
Below is the final dashboard, which is an overview of how anhospital is doing by state
