


Yes, bins are great ! Well I am not talking about your regular bin. In Tableau, you have the ability to create bins. What are they ?
Within Tableau, there are discrete (blue fields) and continuous values (green fields), discrete field can be considered as a set of bins, they split our view and produce headers. Bins introduce a way to convert a continuous measure into set of bins.
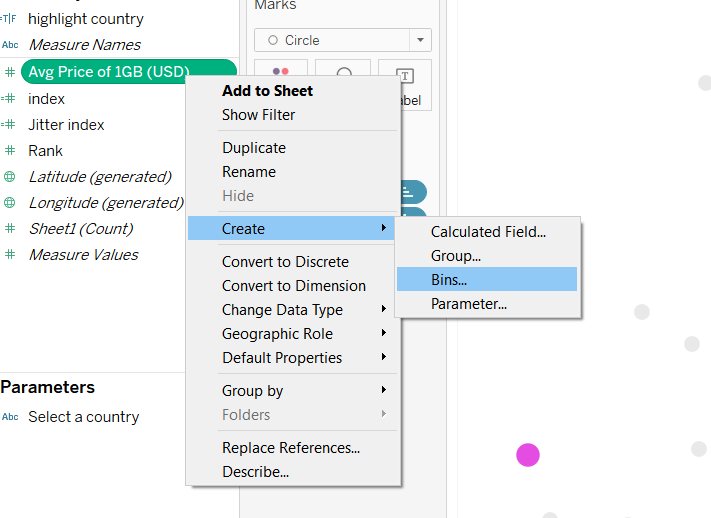
To create them right click on a measure, select create then Bins:
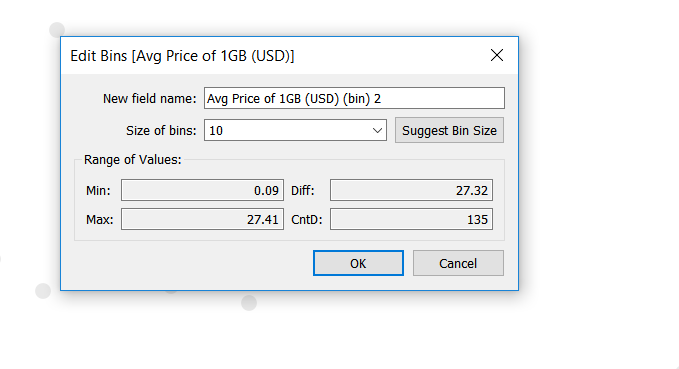
Then you will see this table appear and you can select the size of bins you want:
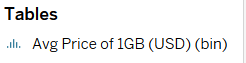
Then you get a dimension with an histogram in front of it:
A use case example for Bins:
While doing my MakeoverMonday this week, I was looking for a way to separate my measure. I didn't know exactly how I wanted to do it. Then I had an idea, Bins!
The data was focused the price of 1GB of mobile data across the world. When I drag country and the Average price for data into the shelf. The data looked like this:
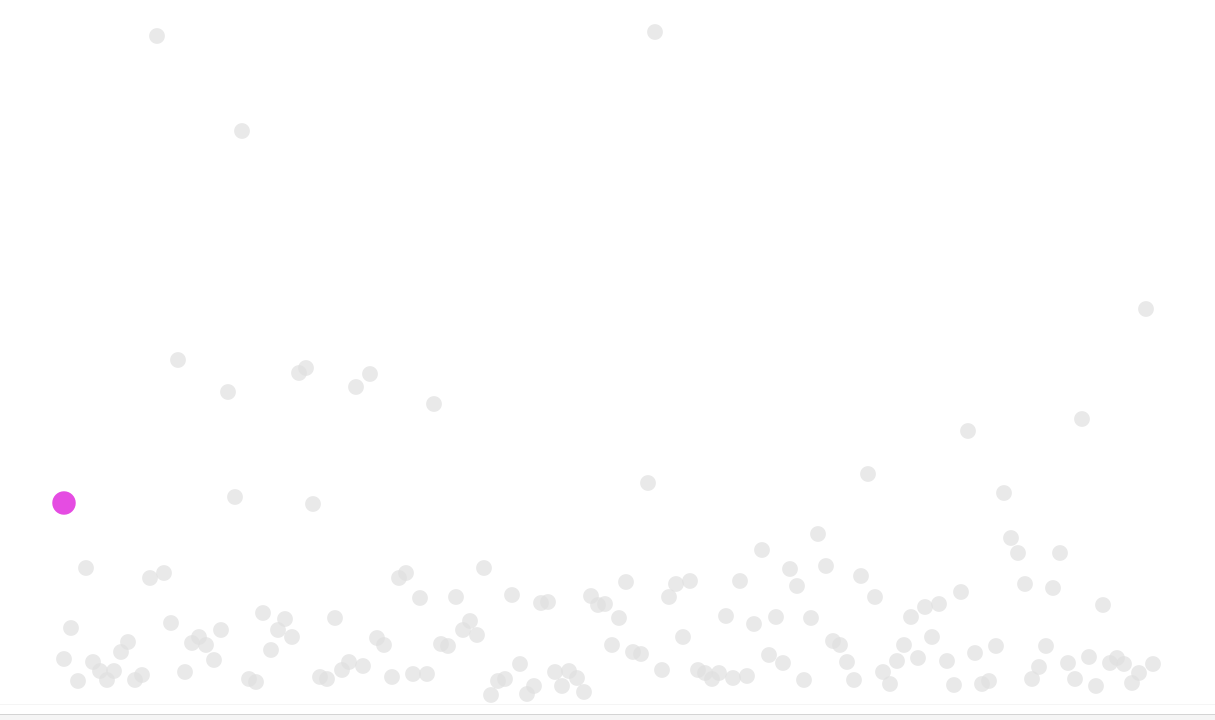
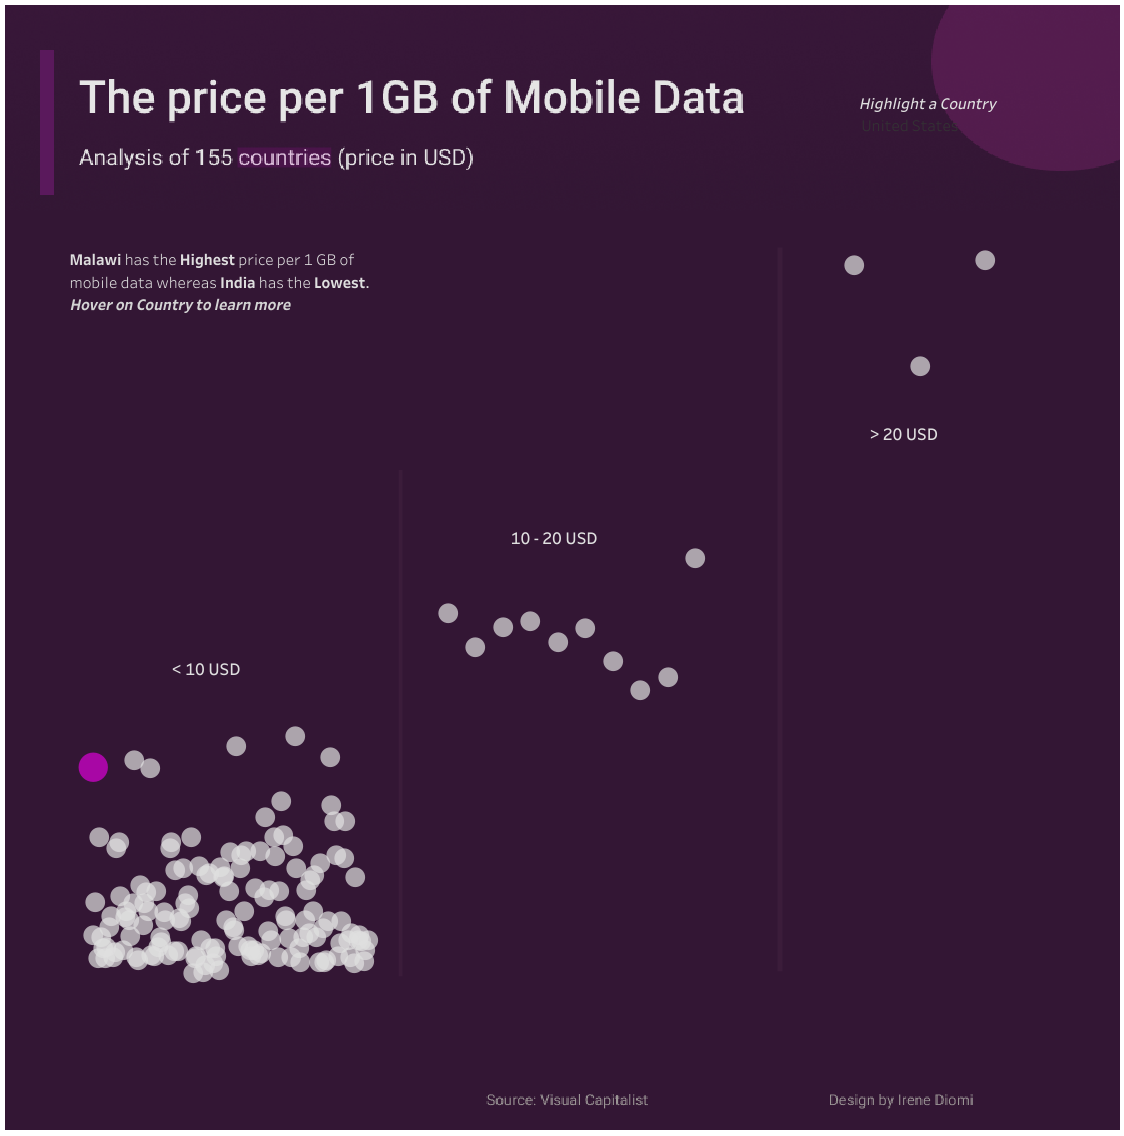
I opted for a scatterplot so every country was represented as a circle. However, I wanted to improve the readability, so I divided my Average price into separate bins: one for the values below 10$, one for the values between 10 and 20 $ and finally the value above 20$. Moreover, it helps see the concentration of values within my data, most countries have their average price below 10$. Here is the final result:
Link to my viz: https://public.tableau.com/views/Book7_16206910572740/Dashboard1?:language=en&:display_count=y&:origin=viz_share_link
I hope this blog post was useful.
Feel free to contact me if you have questions.