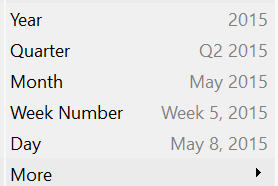
In Tableau, dates can be categorised as discrete or continuous. The difference comes down to whether time is treated as a set of separate categorical buckets or as an unbroken, chronological axis.
When you bring a date field into a view as discrete - shown as a blue pill - Tableau will extract a date part. This is a specific component of a date, such as month, quarter or day of the week. Since discrete dates act as headers rather than an ongoing timeline, Tableau takes all data sharing that specific component across the entire dataset. This makes discrete dates ideal for evaluating seasonal changes or comparing recurring patterns, such as identifying which month of the year historically generates the highest sales. For example, if you choose discrete month (let's say September), Tableau would collect data from September 2021, September 2022 and September 2023.
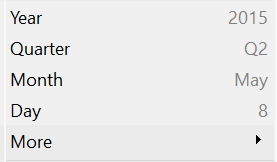
However, a continuous date field - shown as a green pill - Tableau evaluates it as a date value. Instead of picking out a certain date component, Tableau condenses the date to a specific level of detail while still preserving its position along an infinite timeline. This continuous structure creates connected line charts rather than segmented bar charts. Date values are important for time-series analysis and tracking historical trajectories, such as how a world event impacted output. For example, if you choose continuous months, Tableau would collect data from a series of months in a row, like March 2024, April 2024, May 2024, June 2024, in that specific order.