


In today's data-driven world, predictive modeling has become a crucial tool for businesses to forecast trends, make informed decisions, and gain a competitive edge. Tableau is renowned for its powerful data visualization capabilities, but also offers robust features for predictive analytics. Here, we'll delve into how to leverage Tableau's predictive modeling capabilities to unlock valuable insights from your data.
Predictive modeling involves using historical data to make predictions about future outcomes. In Tableau, predictive modeling can be easily achieved using the Model_Quartile function in a Table calculation.
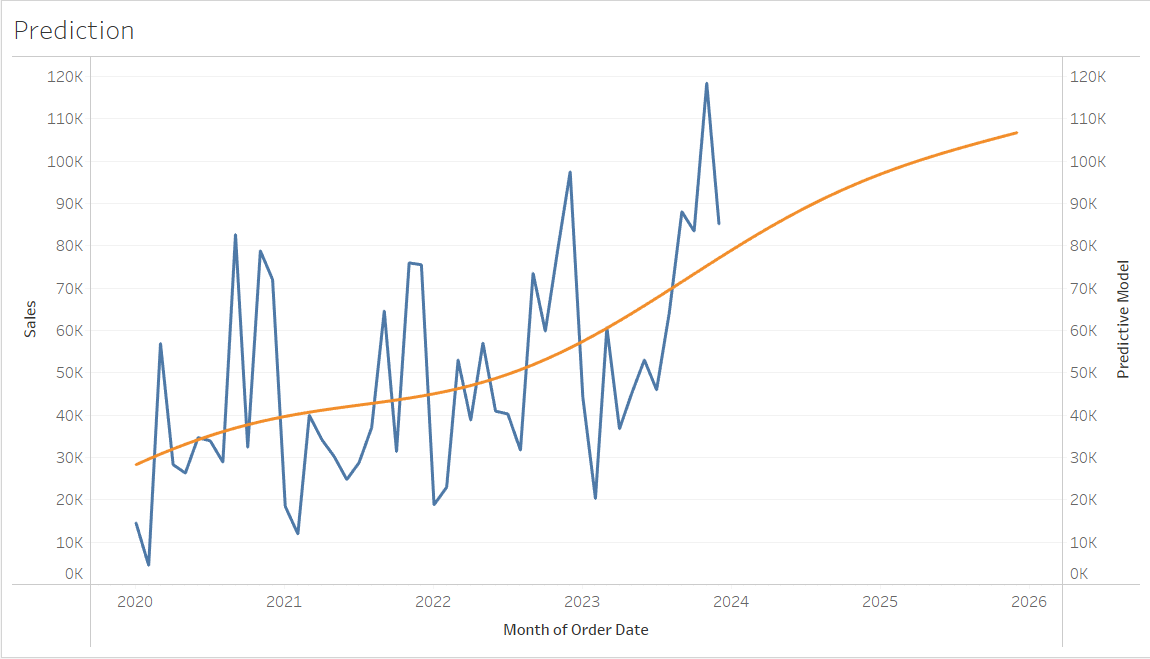
In the graph above, we have created a line chart depicting actual and predicted sales for month of order date using the Tableau Superstore data.
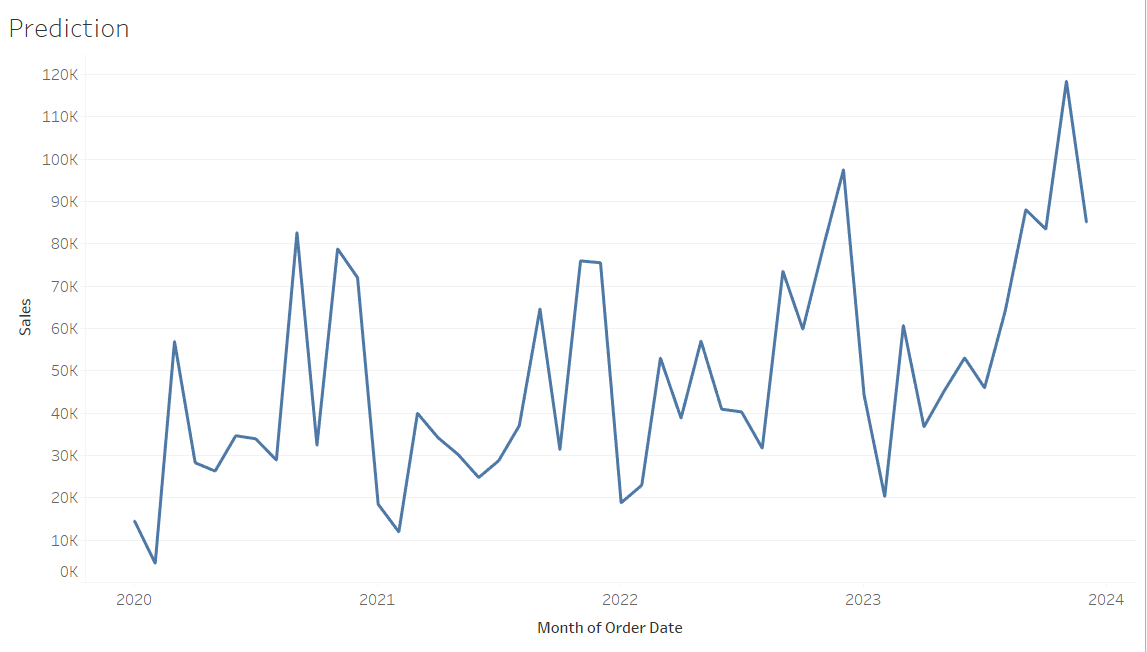
We start by creating a simple line chart by dragging order date onto columns as a continuous variable and changing to month. We then add the sum of sales field onto rows.
To create the predictive model, we need to create a calculated field using the model_quartile function:
MODEL_QUANTILE( "model=gp",0.5,SUM([Sales]) ,ATTR(DATETRUNC('month', [Order Date])) )This function calculates a specified quantile value for a measure, partitioned by the dimensions specified in the visualization.
The components of the calculation are as follows:
- "model=gp" is a parameter that specifies the model type. In this case, "gp" stands for Generalized Pareto model.
- 0.5 - the parameter that specifies the quantile value to calculate. In this example, it corresponds to the median (50th percentile).
- sum(sales) : the model_quartile function will calculate the quantile value based on the cumulative sum of sales data.
- ATTR(DATETRUNC('month', [Order Date])): specifies the level of granularity for the calculation.
We then add this calculation to the rows in the visualisation pane and change this to dual axis.
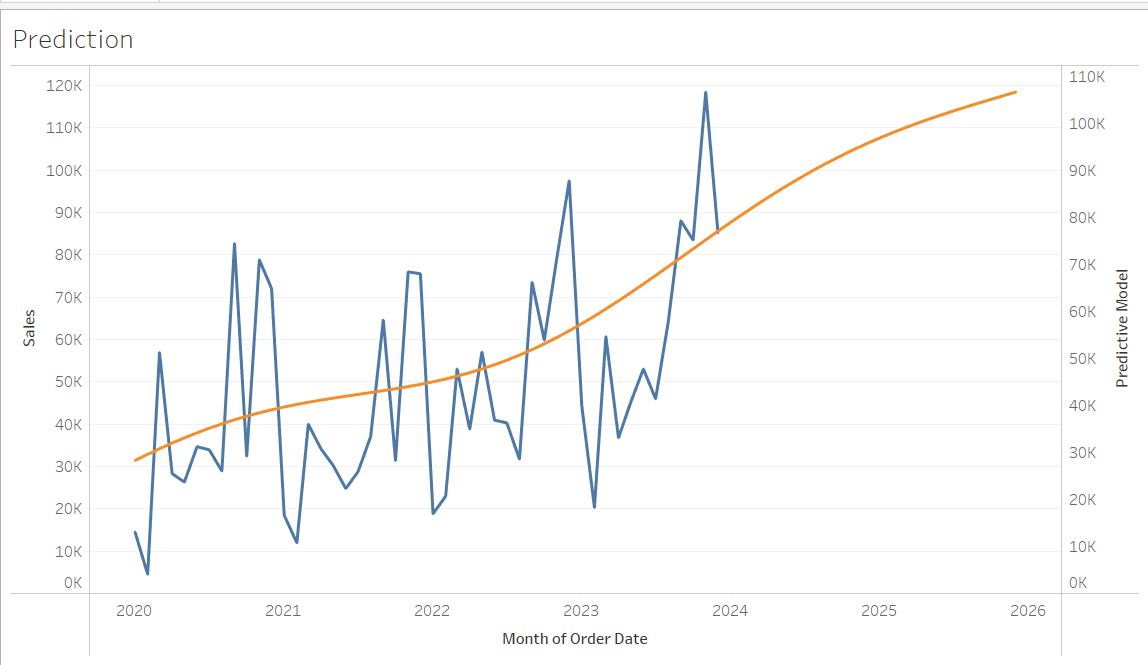
This will add a curved line representing the predictive model for the sum of sales.
While Tableau Desktop doesn't offer advanced machine learning capabilities out-of-the-box, you can still perform basic predictive modeling using calculated fields and custom calculations. By following these steps and leveraging Tableau's intuitive interface and visualization tools, you can derive valuable insights from your data and make informed decisions based on predictive analysis.