


Power BI includes plenty of built-in formatting options for numbers. For many reports, choosing currency, percentage or decimal places from the formatting menu will do exactly what you need. However, sometimes you want a little more control.
You might want negative values shown in brackets, zeros displayed as a dash, large values shortened to millions, or a variance measure shown with an up or down arrow. This is where custom number formats are useful.
A custom format changes how a value is displayed without changing the underlying number. Your measure remains numeric, which means it can still be used in charts, calculations, sorting and conditional formatting.
Where Can You Apply a Dynamic Format?
In Power BI, number formats can be applied at several levels:
For reusable measures such as Total Sales, Profit Margin or Sales Variance, applying the format at model level is often the neatest option, but the Dynamic Format option in the report view offers extra flexibility.
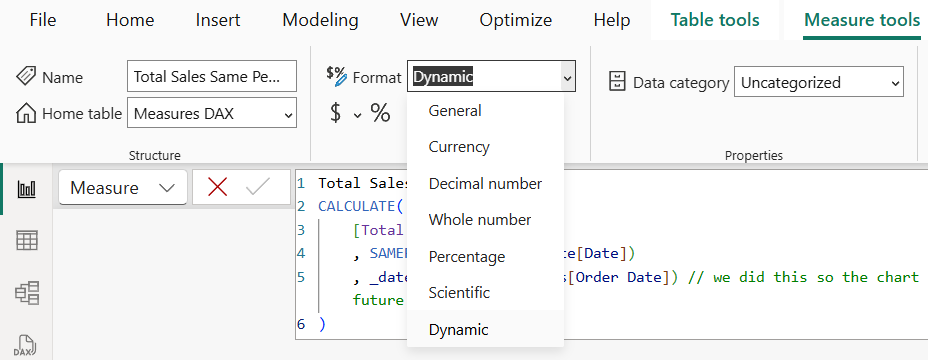
To do this, select the measure or column in the data pane, go to the formatting options in the Properties or Measure tools pane, choose Dynamic, and enter the required format string.
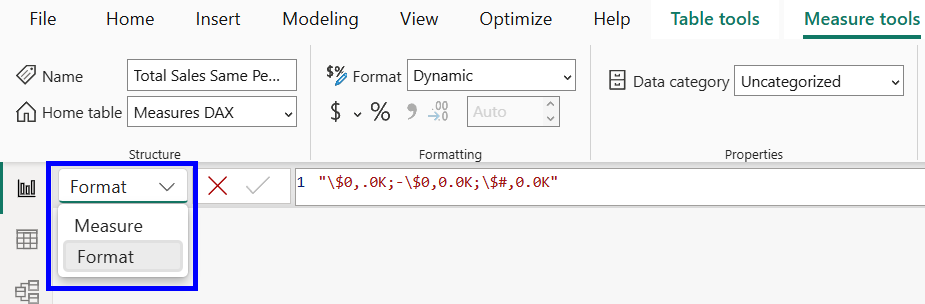
The format string can be changed by selecting the measure in the data pane and using the dropdown to the left of the formula bar, and changing Measure to Format.
The Structure of a Custom Number Format
In Power BI, a custom number format can contain up to three sections, separated by semicolons:
For example:
£#,##0;(£#,##0);-
This tells Power BI to display:
This is similar to custom number formatting in Tableau.
Useful Formatting Characters
Some Practical Examples
Scaling - Custom Formats vs Display Units
A comma at the end of a number format scales the displayed value by 1,000. Two commas scale it by 1,000,000, and three commas scale it by 1,000,000,000.
This means the format below displays a value in millions:
£#,##0.0,,"M" A value of 12500000 would therefore display as £12.5M.
Power BI visuals also include a Display units option, which can automatically shorten large values to thousands, millions or billions.
For a simple card or axis, this may be all you need. However, if you create your own custom abbreviated format, such as the millions example above, it is usually best to set the visual's Display units to None. Otherwise, Power BI may apply its own automatic scaling as well as your custom format, producing unexpected results.
Custom Formats vs Conditional Formatting
A custom number format changes the way a value is written. For example, it can add an arrow to show whether a variance is positive or negative:
"▲ "£#,##0;"▼ "£#,##0;"-"
However, a custom format does not control the colour of the value. If you also want increases displayed in green and decreases displayed in red, that should be handled separately using conditional formatting.
Using a Lookup Table for Dynamic Format Strings
Dynamic Format Strings are most useful when the format needs to respond to the report context.
For example, Microsoft’s documentation (link at the end) shows a currency conversion measure where the selected country or region controls how the result is displayed. The measure calculates the converted sales amount, while the format string changes separately.
This is done using a small lookup table containing the currency format for each country or region. For example, that table might contain a column like this:
'Country/Region Currency Format Strings'[Format]
Each row in that column stores the format string that should be used for a particular country or region, such as:
£#,0$#,0.00¥#,0
The Dynamic Format String then uses DAX to return the correct format from the lookup table:
SELECTEDVALUE(

  'Country/Region Currency Format Strings'[Format],

  "$#,0.00;($#,0.00);$#,0.00"

)
The first part tells Power BI which column contains the possible format strings:
'Country/Region Currency Format Strings'[Format]
The second part is the fallback format:
"$#,0.00;($#,0.00);$#,0.00"
This fallback is used when Power BI cannot return one single format from the lookup table. For example, this might happen if no country is selected, or if multiple countries are selected.
The useful part is that the measure itself remains numeric. The lookup table and DAX expression only control how the value is displayed, so the measure can still be used properly in charts, calculations, sorting and conditional formatting.
Link to documentation: https://learn.microsoft.com/en-us/power-bi/create-reports/desktop-dynamic-format-strings