


Now that DSNY12's training is coming to end, we get to do Dashboard Week! Dashboard Week is a full week of projects related to all of the training we've done over the past few months, and the first task of the week was to focus on data structuring!
Our task for the first day of Dashboard Week was to choose our own dataset and spend the day creating sketches and a schema for the dataset to present.
I wanted to select a dataset that I could make some kind of argument based on as we would be coming up with a user story as well, and the one that jumped out at me most was a dataset on college major career analytics. Looking at how many of the columns focused on estimated future income, I thought that it could be a useful data source for a university that’s trying to determine which programs to offer at their school to maximize future alumni donations.
You can find the dataset I used here! > https://www.kaggle.com/datasets/srisyra02/college-major-career-analytics-dataset/data
Splitting my facts and dimensions tables took awhile because there were a lot of different columns to sort through, and I didn’t want to keep all of them. I wanted to focus on the user story I had come up with, which meant going through the dataset with a fine-tooth comb to remove columns that would serve no purpose other than to slow down my processing time.
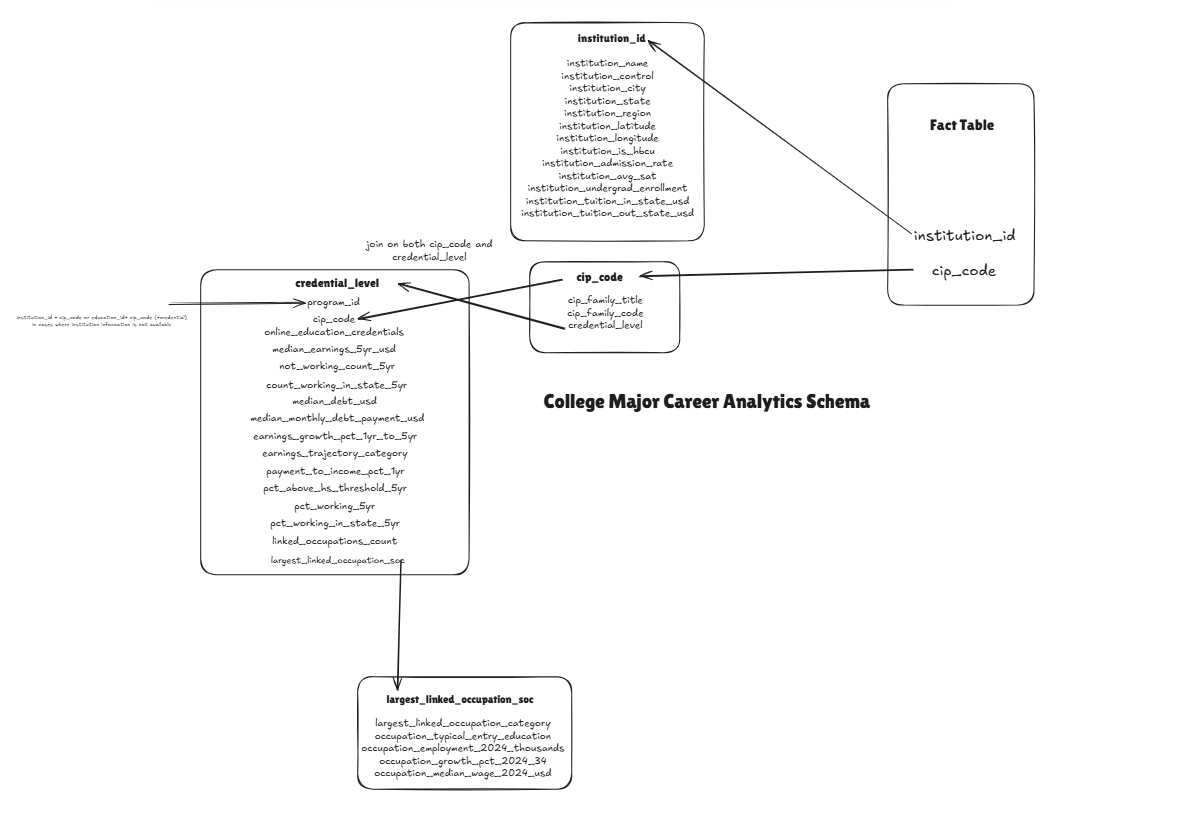
After sketching it out, I went into Snowflake to work on the SQL for creating the tables.
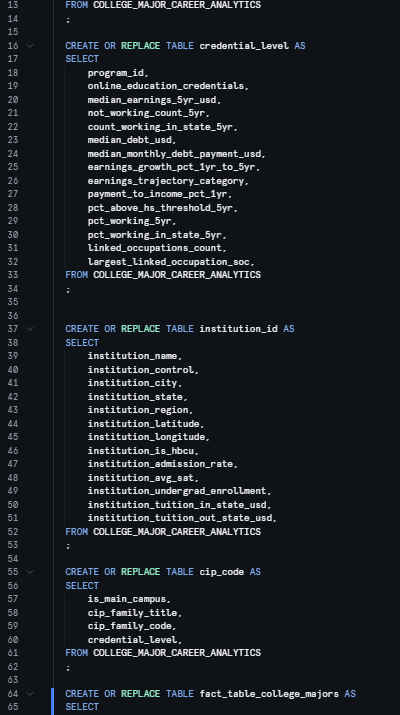
One blocker that the entire cohort went through at first was that we didn’t seem to have the credentials to export our data from Snowflake into Tableau, but eventually Sean Fei realized that it was because we were using the correct version of Tableau. However, this did push back everyone’s timelines a bit. Fortunately, we were able to connect fairly quickly once we figured it out.
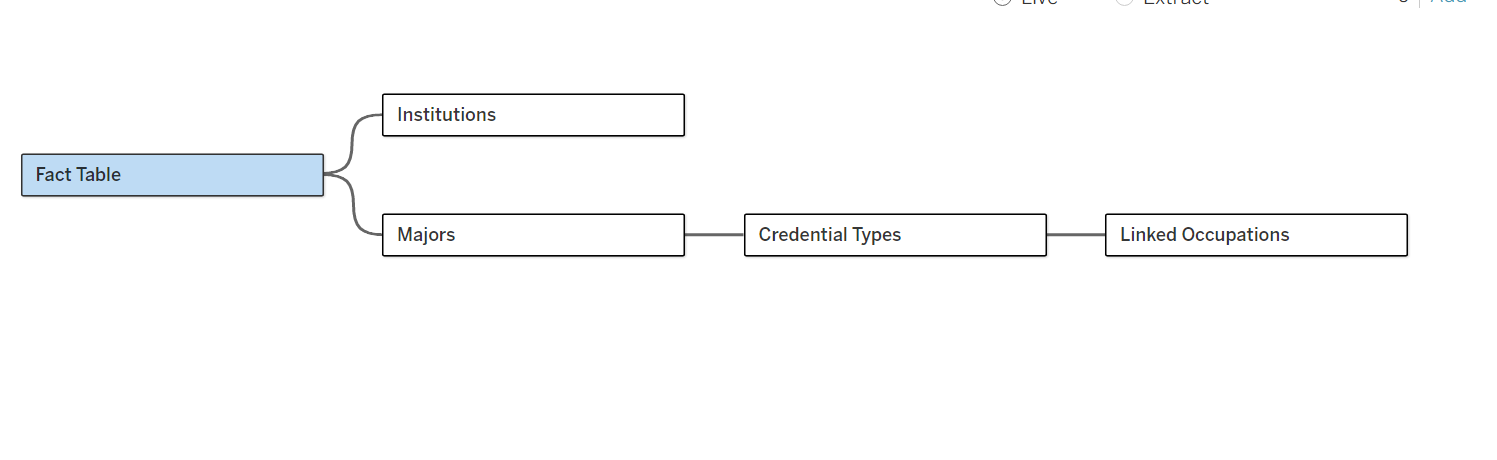
Once I was able to connect to Snowflake through Tableau, I added all of my tables into the Data Source panel and connected them. Originally, I had named all of my tables what the connecting field was, but now that they were connected, I renamed them within Tableau to make it easier to immediately understand what kind of information would be inside all of them.
This project was a really great way of experiencing all of the effort that goes into building out and structuring the kinds of datasets we use so often. It also ensures that while working with clients, we’re always ready to do some structuring if the moment comes.
Looking forward to day 2!