


In our second task on day 2 of the Dashboard Week we could choose an industry of our likes and we were supposed to create the data fitting to that industry by ourselves with Mockaroo.
I chose a video rental company and I had two difficult things I wanted to be represented in the data.
- change over time in mockaroo
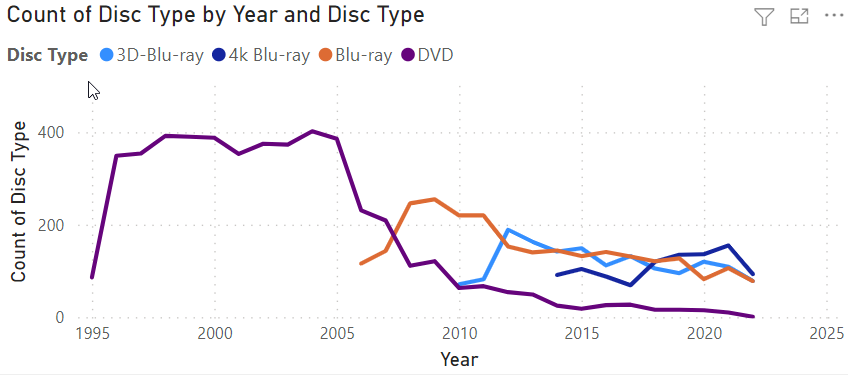
I had a dimension with disk type of the rented video (Blu-ray, DVD,...) but I wanted the data in a way, that the DVD is dominant in the 90s but in the 2000s the Blu-ray joins the party and more and more takes over.
I managed to do this with a custom list and several formulas as you can see here:
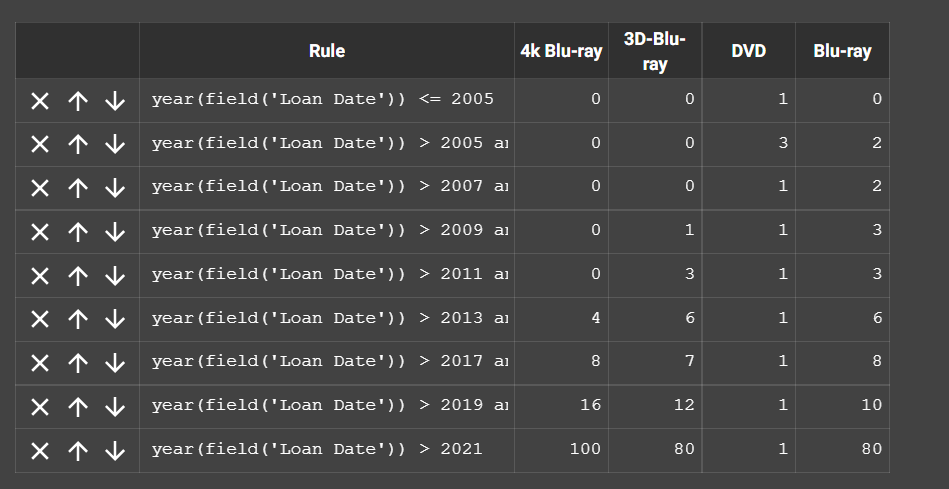
Except of the first formula it was important to also have a start and beginning of each time period like this:
year(field('Loan Date')) > 2005 and year(field('Loan Date')) <= 2007
With these formulas in the distribution my line chart in the end looked like this:
2. having dates related to each other
I had a signing date for each customer of my video rental company and for some of the customers I had also a termination date. I wanted to be sure that the termination doesn't lie before the signing date, so I defined the termination date like with the formula field embedded in the date field (right red rectangle in the picture below):
field('Signing Date') + days(random(0,30)) + month(random(0,12)) + year(random(0,8))
With this formula we add randomly termination dates that are later than the signing dates.

Unfortunately the max date (left red rectangle) is overwritten by the formula and I had some termination dates lying in the future. I could not handle this problem but if you're familiar with Ruby, I'm sure there is also a solution for this.