


The final day of dashboard week (and my final project whilst in training) focused on Lego data. We were given twelve individual Lego datasets and had a choice of themes to focus our analysis on. The theme I settled on was football focused...
The Tactical Shift: Soccer sets historically pioneered interactive, spring-loaded tabletop gameplay mechanics. Analyse how the part counts and set counts changed when LEGO shifted from these interactive "playable" pitches of the early 2000s to the massive, luxury display stadiums of the 2020s.
Team Kits: Map out the dominant brick colors used in these sets to see if LEGO favours iconic, high-contrast primary colors for stadium builds and player kits.
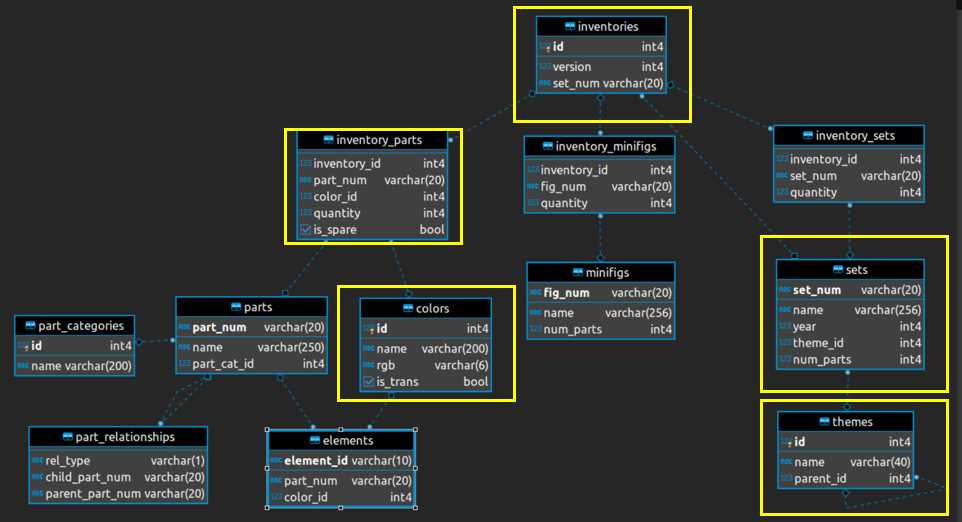
Once looking over the schema and settling on this theme, I tried to narrow down the fields and tables which would be relevant for my analysis. See figure 1 for the schema and the highlighted tables.
A key requirement for this project was loading the tables into a SQL database and then querying/transforming the relevant data. This was done in snowflake. The query written is shown below.
CREATE VIEW Lego_Dashboard_Data_HLS AS

SELECT
   //Defined in the brief as analytical eras
    CASE
        WHEN s.year BETWEEN 1998 AND 2006 THEN 'Interactive Play Era'
        WHEN s.year BETWEEN 2007 AND 2019 THEN 'Dormant Era'
        WHEN s.year >= 2020 THEN 'Luxury Display Era'
        ELSE 'Other'
    END AS football_era,

s.year AS release_year,
s.set_num,
s.name AS set_name,
s.num_parts AS total_set_parts,


c.name AS color_name,
CONCAT('#', c.rgb) AS color_hex,
SUM(ip.quantity) AS brick_qty

FROM sets s
JOIN themes t ON s.theme_id = t.id
JOIN inventories i ON s.set_num = i.set_num
JOIN inventory_parts ip ON i.id = ip.inventory_id
JOIN colors c ON ip.color_id = c.id

//Filter Football Themes
WHERE t.name ILIKE '%Soccer%'
   OR t.name ILIKE '%Football%'
   OR s.name ILIKE '%Stadium%'
   OR s.name ILIKE '%Old Trafford%'
   OR s.name ILIKE '%Camp Nou%'
   OR s.name ILIKE '%Bernabéu%'
   OR (t.name IN ('Creator Expert', 'Icons', 'LEGO Icons') AND (s.name ILIKE '%Stadium%' OR s.name ILIKE '%Arena%'))

//Final table granuity to a set level
GROUP BY
    s.year,
    s.set_num,
    s.name,
    s.num_parts,
    c.name,
    c.rgb;
In short the query is looking only for football related data (see the WHERE statement). The final output is then grouped by six fields which gives a final granularity of one row per colour per set. I then connected directly to the database through Tableau (instead of downloading an Excel file).
There were a few considerations I had in mind for the final dashboard which are as follows:
- The ability to view individual sets which were football themed – this meant extensive filtering
- The ability to track how the complexity of football sets has changed between two distinct eras (i.e. number of parts per set)
- Track the most common colors by year
- View a colour breakdown of individual sets
- The dashboard needed to have a logical flow (i.e. track colour and complexity on a year and set level)
With this in mind, I created the following sketch shown in figure 2:
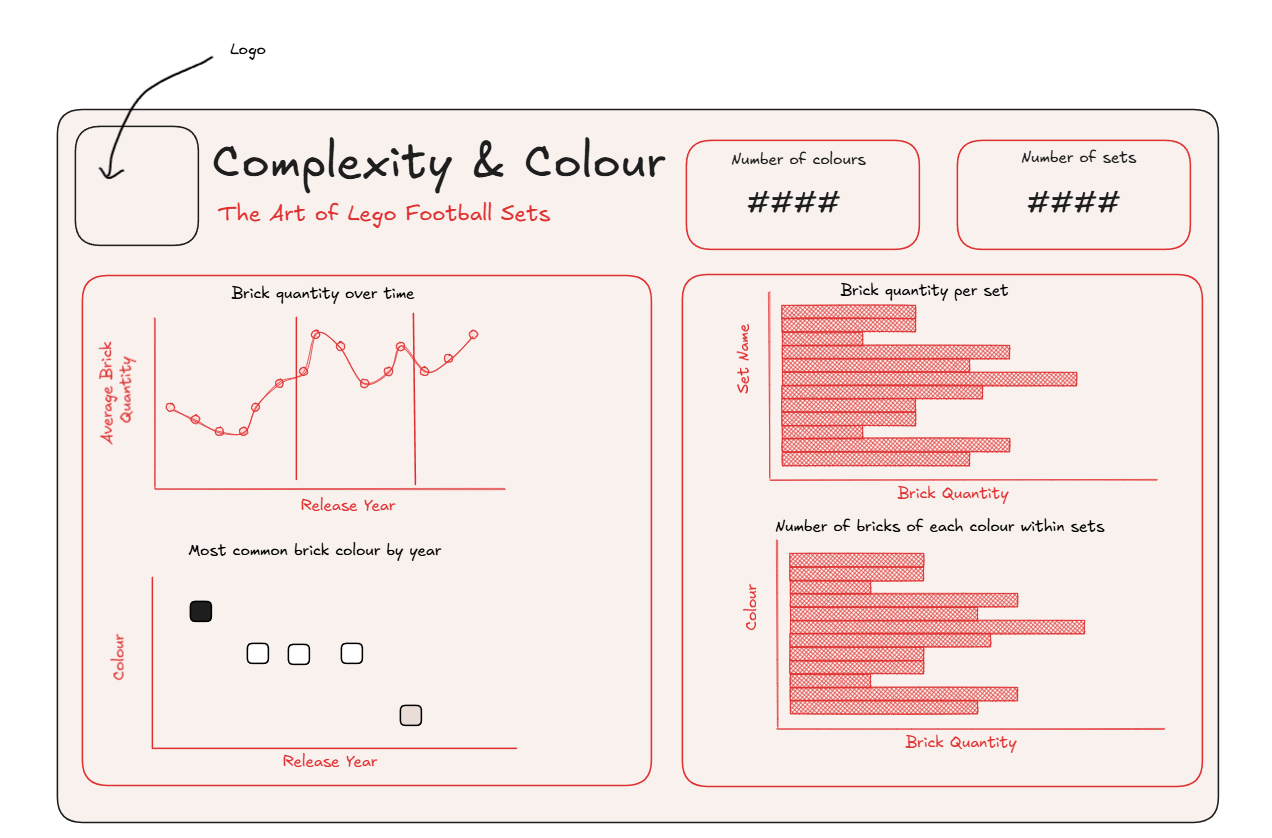
The final dashboard is shown below and roughly follows the sketch...

With that the final training project is completed, it was certainly a high pressure challenge but a rewarding one.