


When learning a new skill, it is always important to practice, practice and practice! Thus, I have been using the Preppin' Data Challenges to hone my skills in SQL and Snowflake. These are weekly exercises to help you learn and develop data preparation skills. The challenges are designed for learning Tableau Prep but they can be completed in R, Python, SQL, DBT, EasyMorph and many other tools.
To start, I will be completing challenge 2023- Week 6. This challenge involves looking a customer survey data for a fictional bank. Customers had to rate the bank's online interface and mobile app on a scale of 1 to 5 in different areas. The link to the challenge is: https://preppindata.blogspot.com/2023/02/2023-week-6-dsb-customer-ratings.html
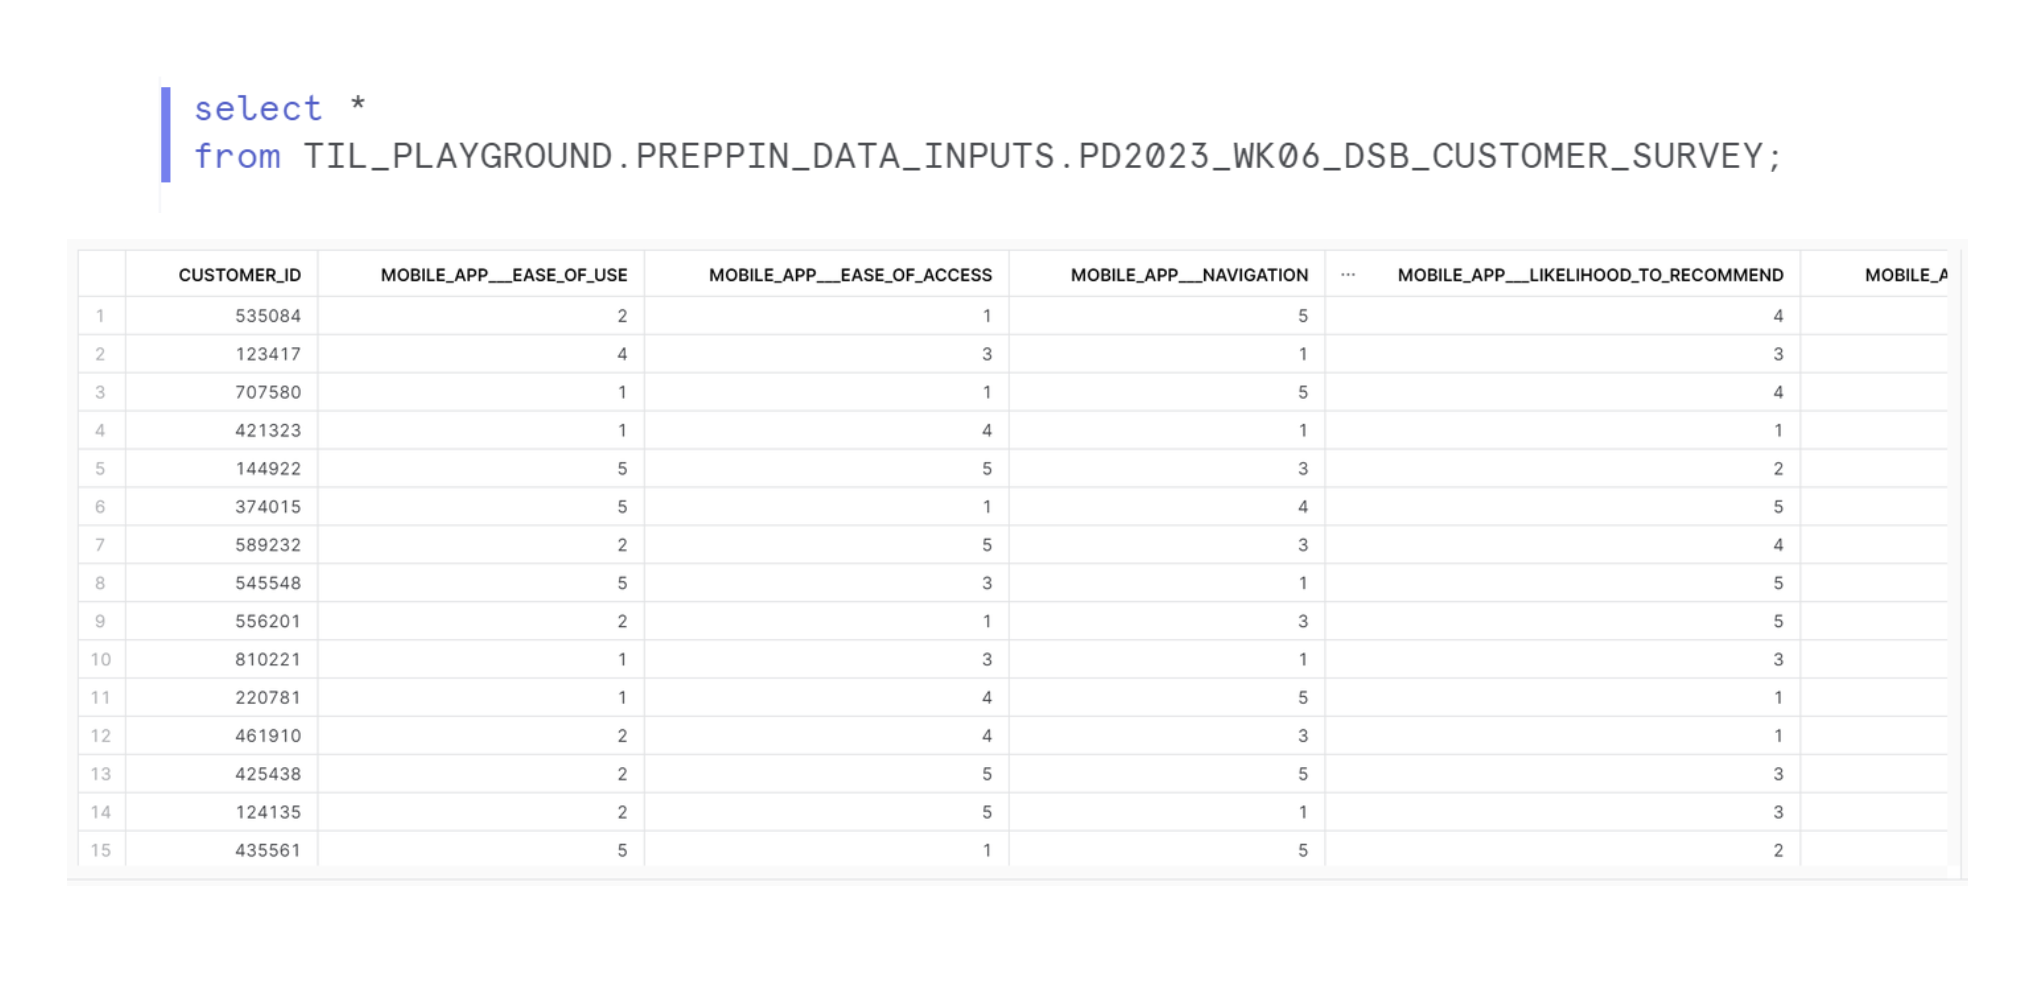
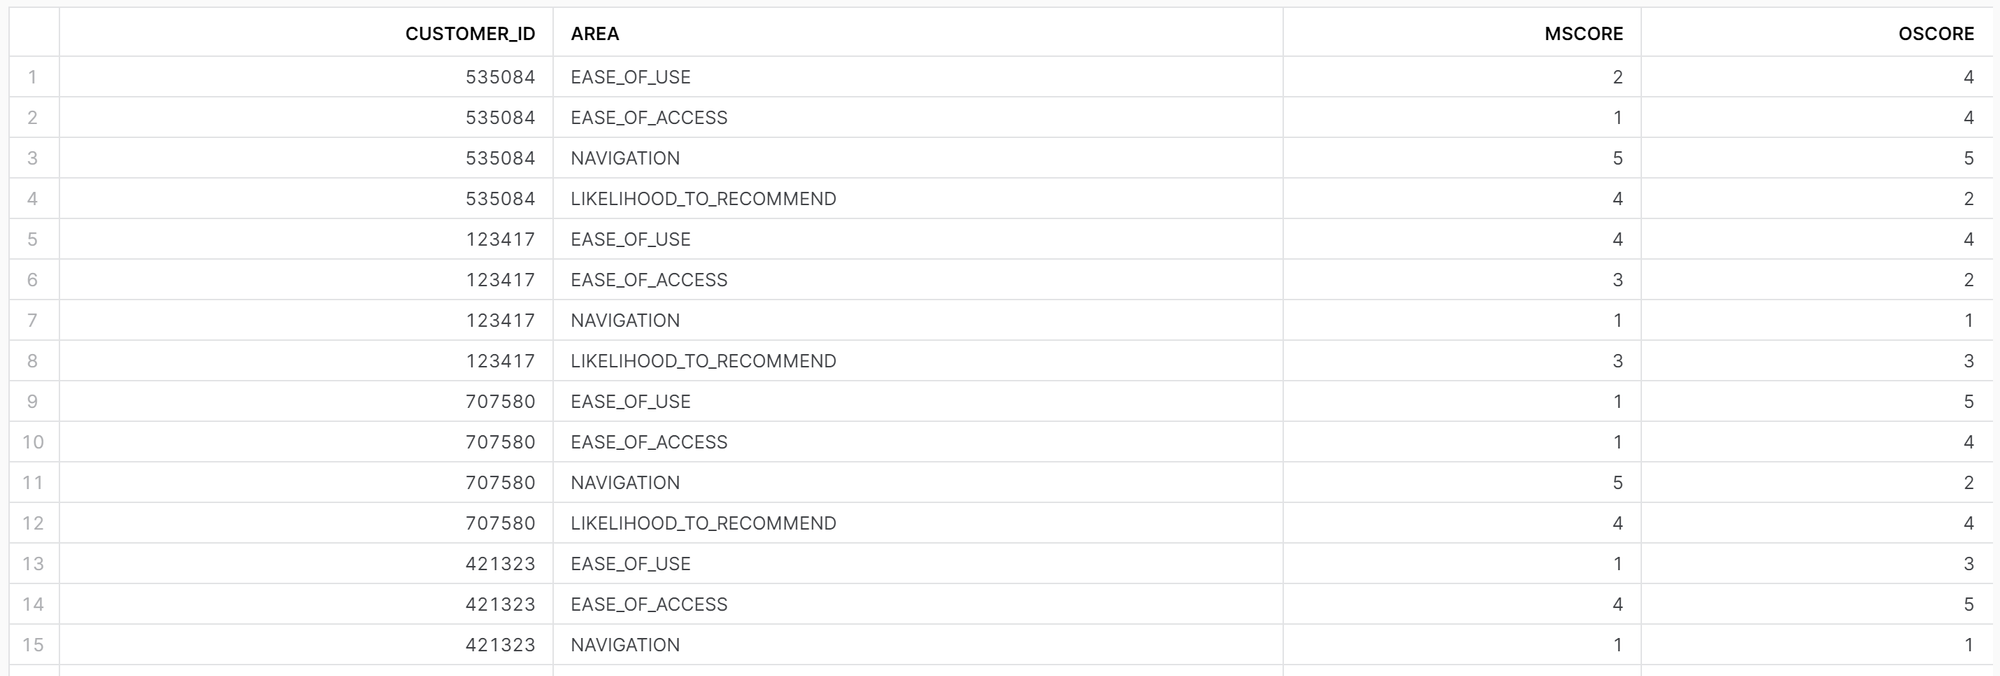
To start, I brought the data in to inspect it, using the select * to bring in all columns from the tables.
The main requirement for this challenge is to reshape the data so we have 5 rows for each customer, with responses for the Mobile App and Online Interface being in separate fields on the same row. This means we need to pivot:
- MOBILE_APP___EASE_OF_USE, ...EASE_OF_ACCESS, ...NAVIGATION, ...LIKELIHOOD_TO_RECOMMEND, ...OVERALL_RATING for a Mobile column,
- then ONLINE_INTERFACE___EASE_OF_USE, ...EASE_OF_ACCESS, ...NAVIGATION, ...LIKELIHOOD_TO_RECOMMEND, ...OVERALL_RATING for a Online column.
To create multiple pivots, I decided to do two separate pivots (one for mobile and one for online) in two separate tables. Then through CTEs, I could join the two tables on the survey area field. This would mean each customer will have 5 rows covering each survey area across mobile and online!
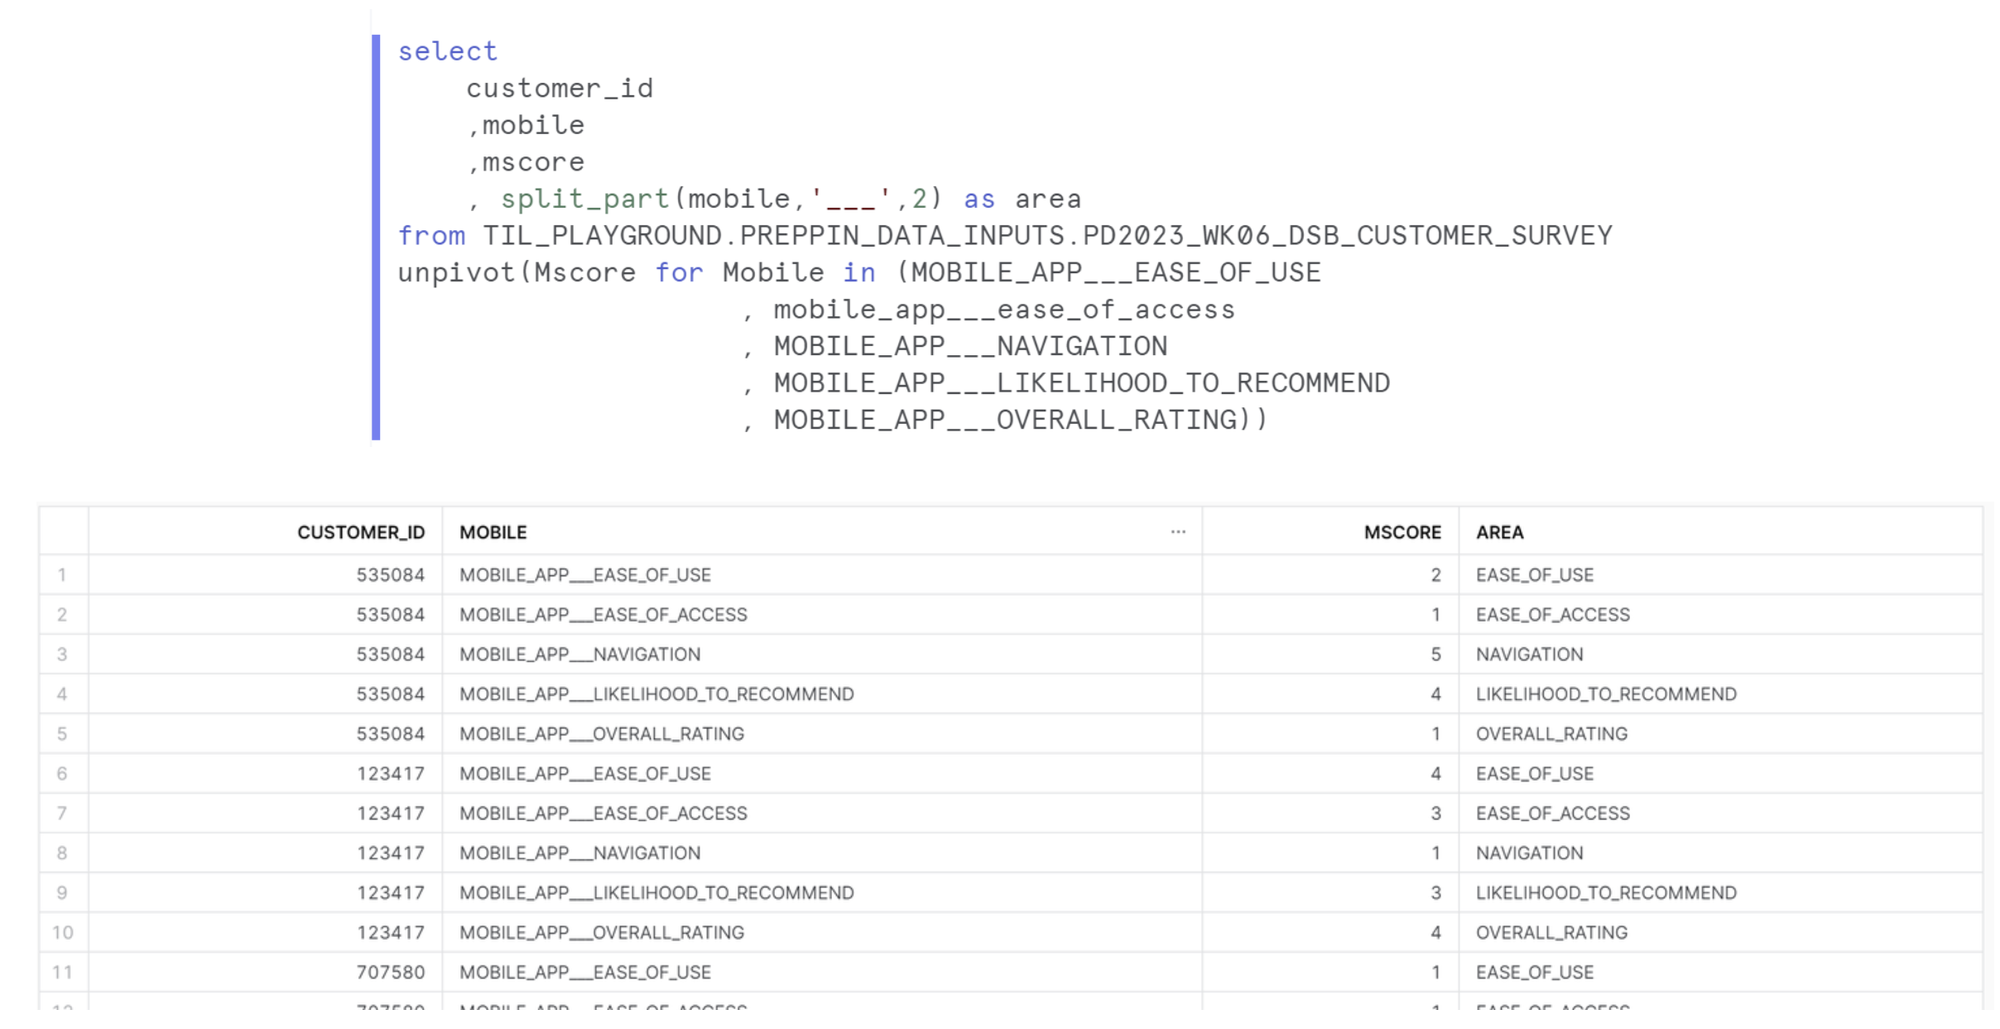
The first table I made was for the mobile questions. Pivoting headers to rows requires the UNPIVOT syntax. This is how you structure an unpivot in SQL.

Therefore, I created and new field with all of the mobile survey areas called MOBILE and a new column for all the values called MSCORE. I then listed all the headers that I'm pivoting.
To create a joining field for the Online table, I need to clean up the MOBILE column to match the eventual ONLINE column. However, both fields contain MOBILE_APP___ and ONLINE_INTERFACE___ respectively. Therefore I added a SPLIT_PART function that take the string after the '___'.
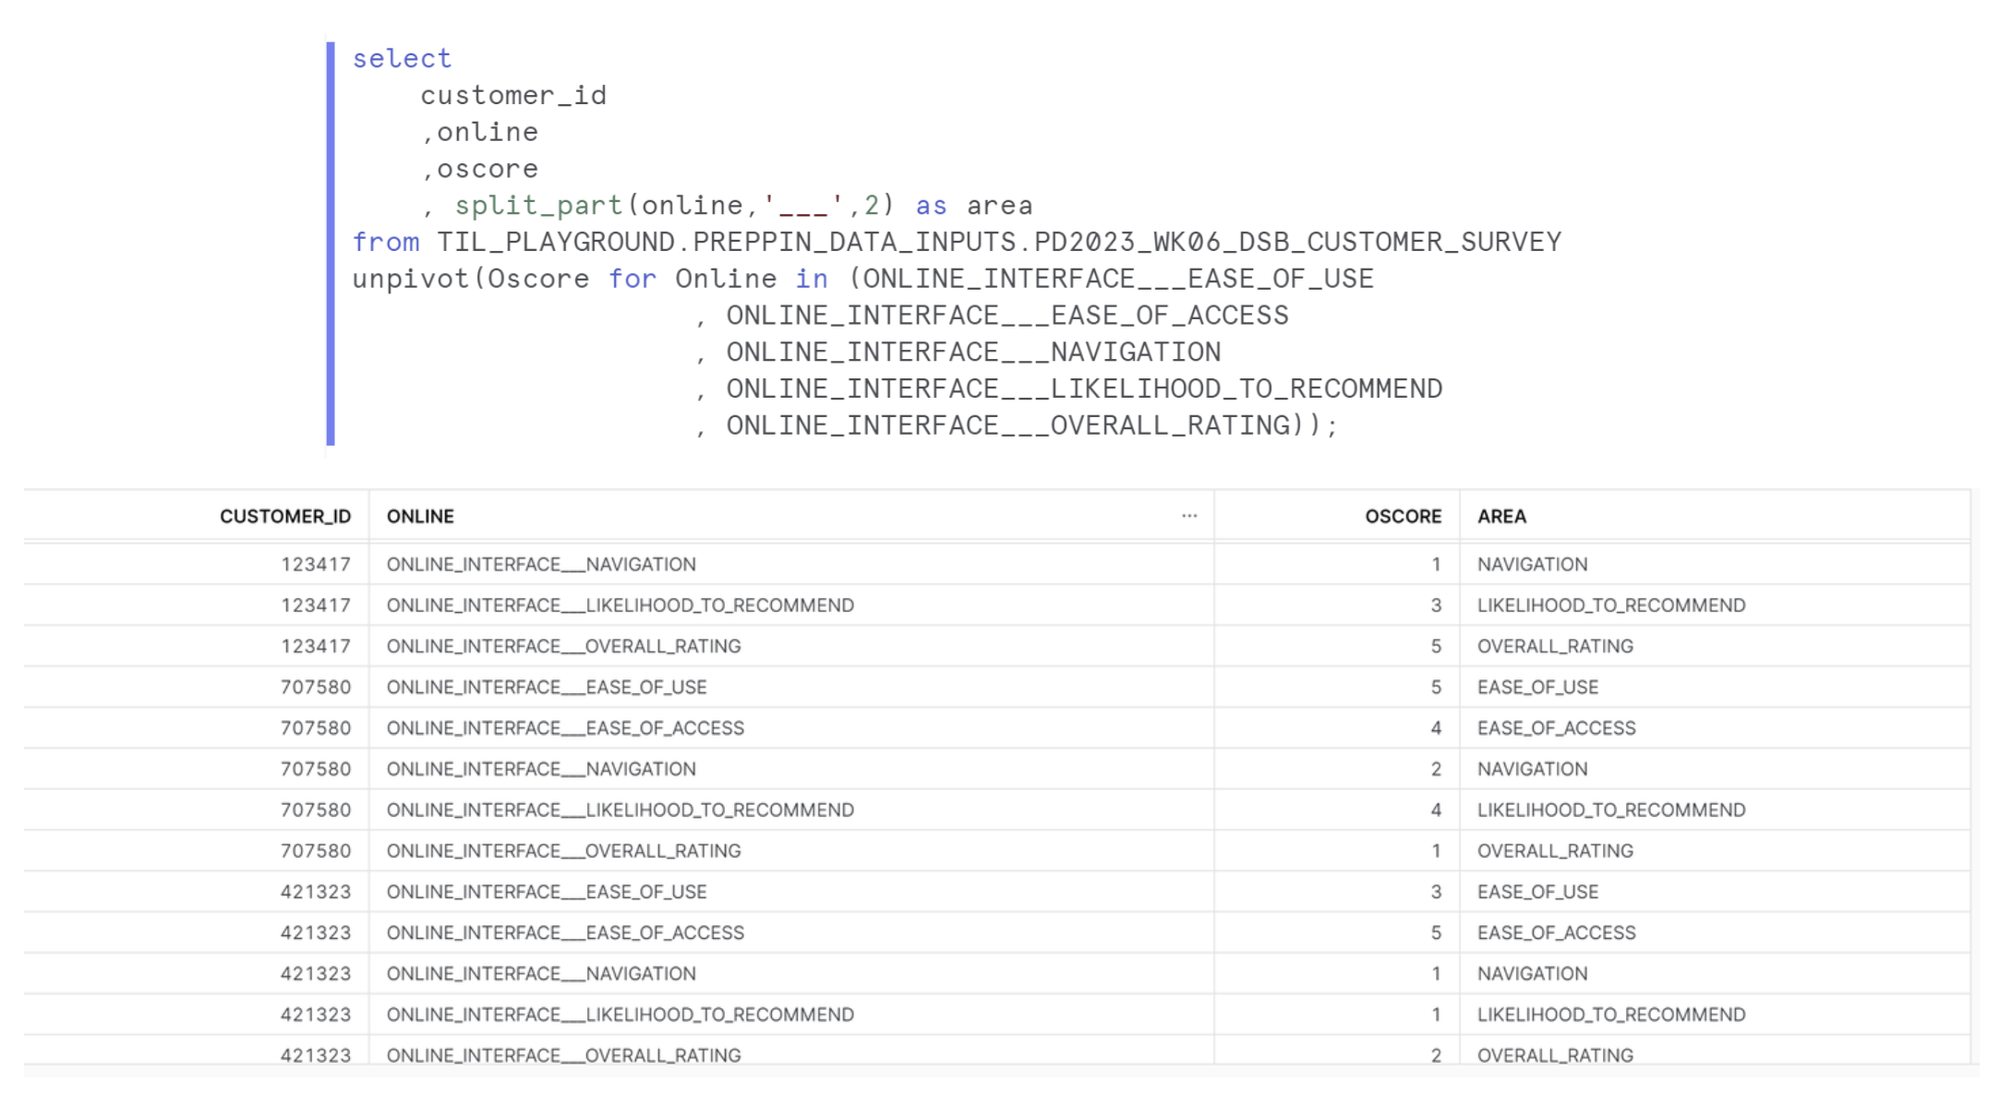
This process was repeated for the online section.
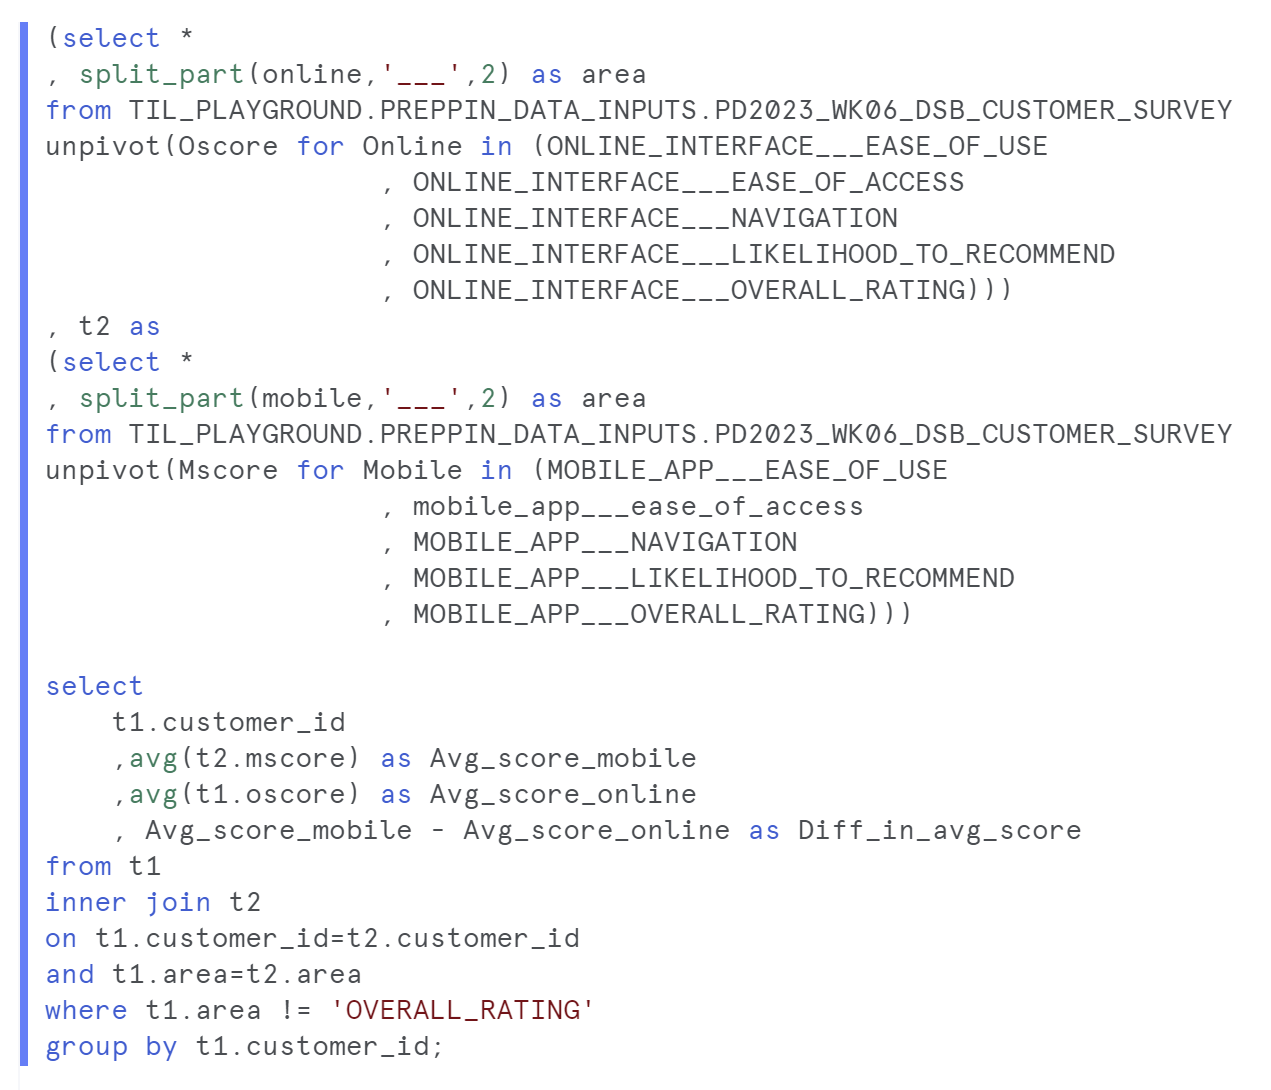
We then put the two tables we made into CTEs, these are labeled t1 and t2 respectively. We then select the fields we want to keep so either of the customer IDs, either of the new area field and the two score fields (these need to be labeled with the correct alias from the CTE).
We then do a simple inner join, linking on customer ID and area so each row is a unique combination of ID and question area.
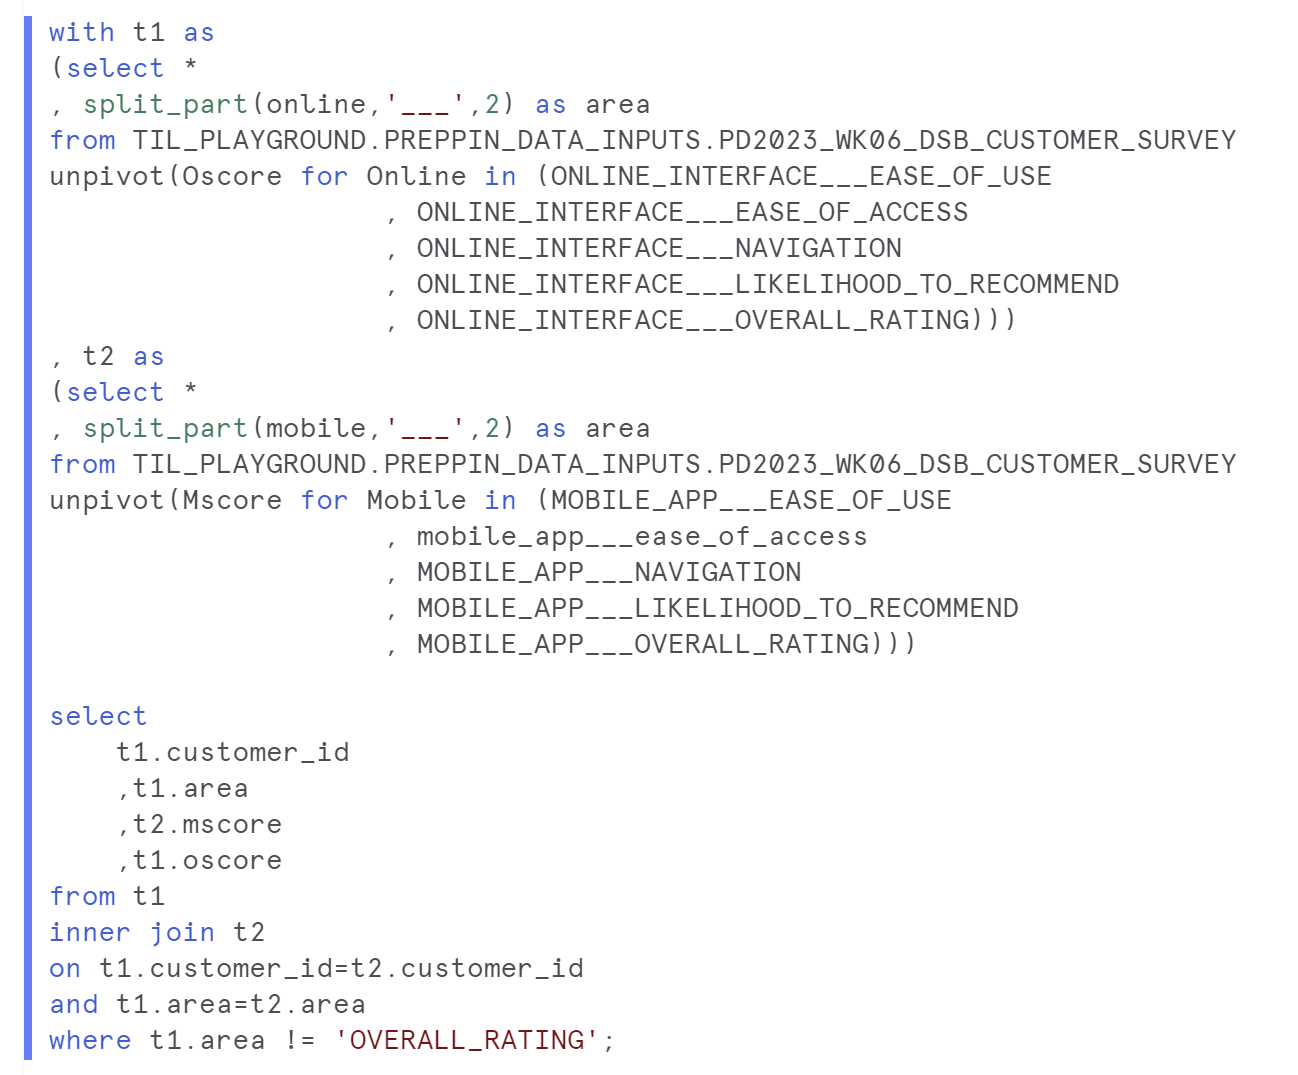
and this is the table we create!
The next requirements for the challenge was to:
- Exclude the Overall Ratings, these were incorrectly calculated by the system
- Calculate the Average Ratings for each platform for each customer
- Calculate the difference in Average Rating between Mobile App and Online Interface for each customer
The structure of the query didn't change, I still used the t1 and t2 CTEs and join.
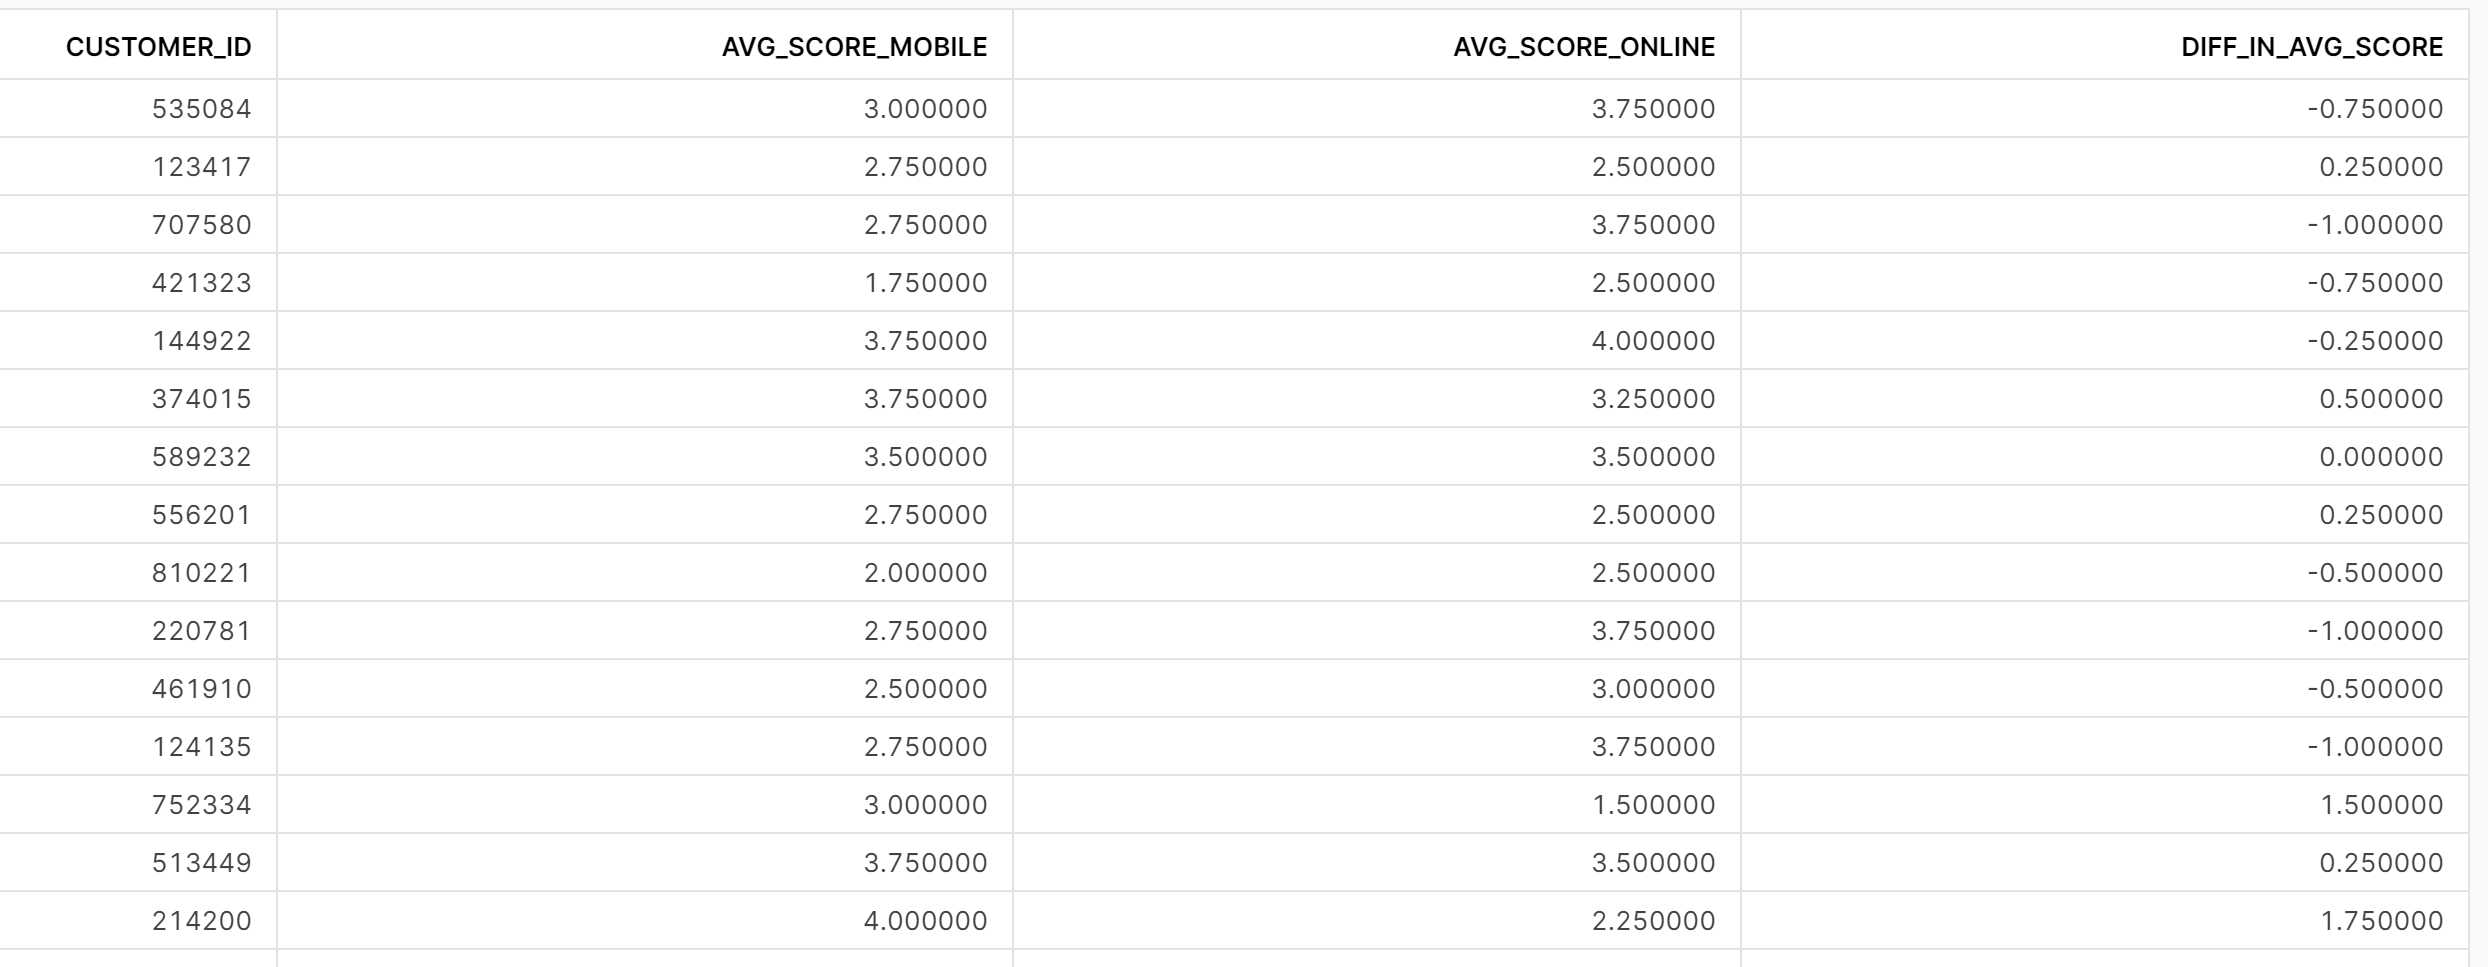
- To exclude the OVERALL_RATING section, we use the where function after the select/from. We say that the question area column doesn't contain (!=) 'OVERALL_RATING'.
- To get the average rating for each platform and each customer, we need to aggregate the data. I did this by using the group by function, grouping at the customer ID level. Instead of a customer ID having 5 rows each, it will only be 1.
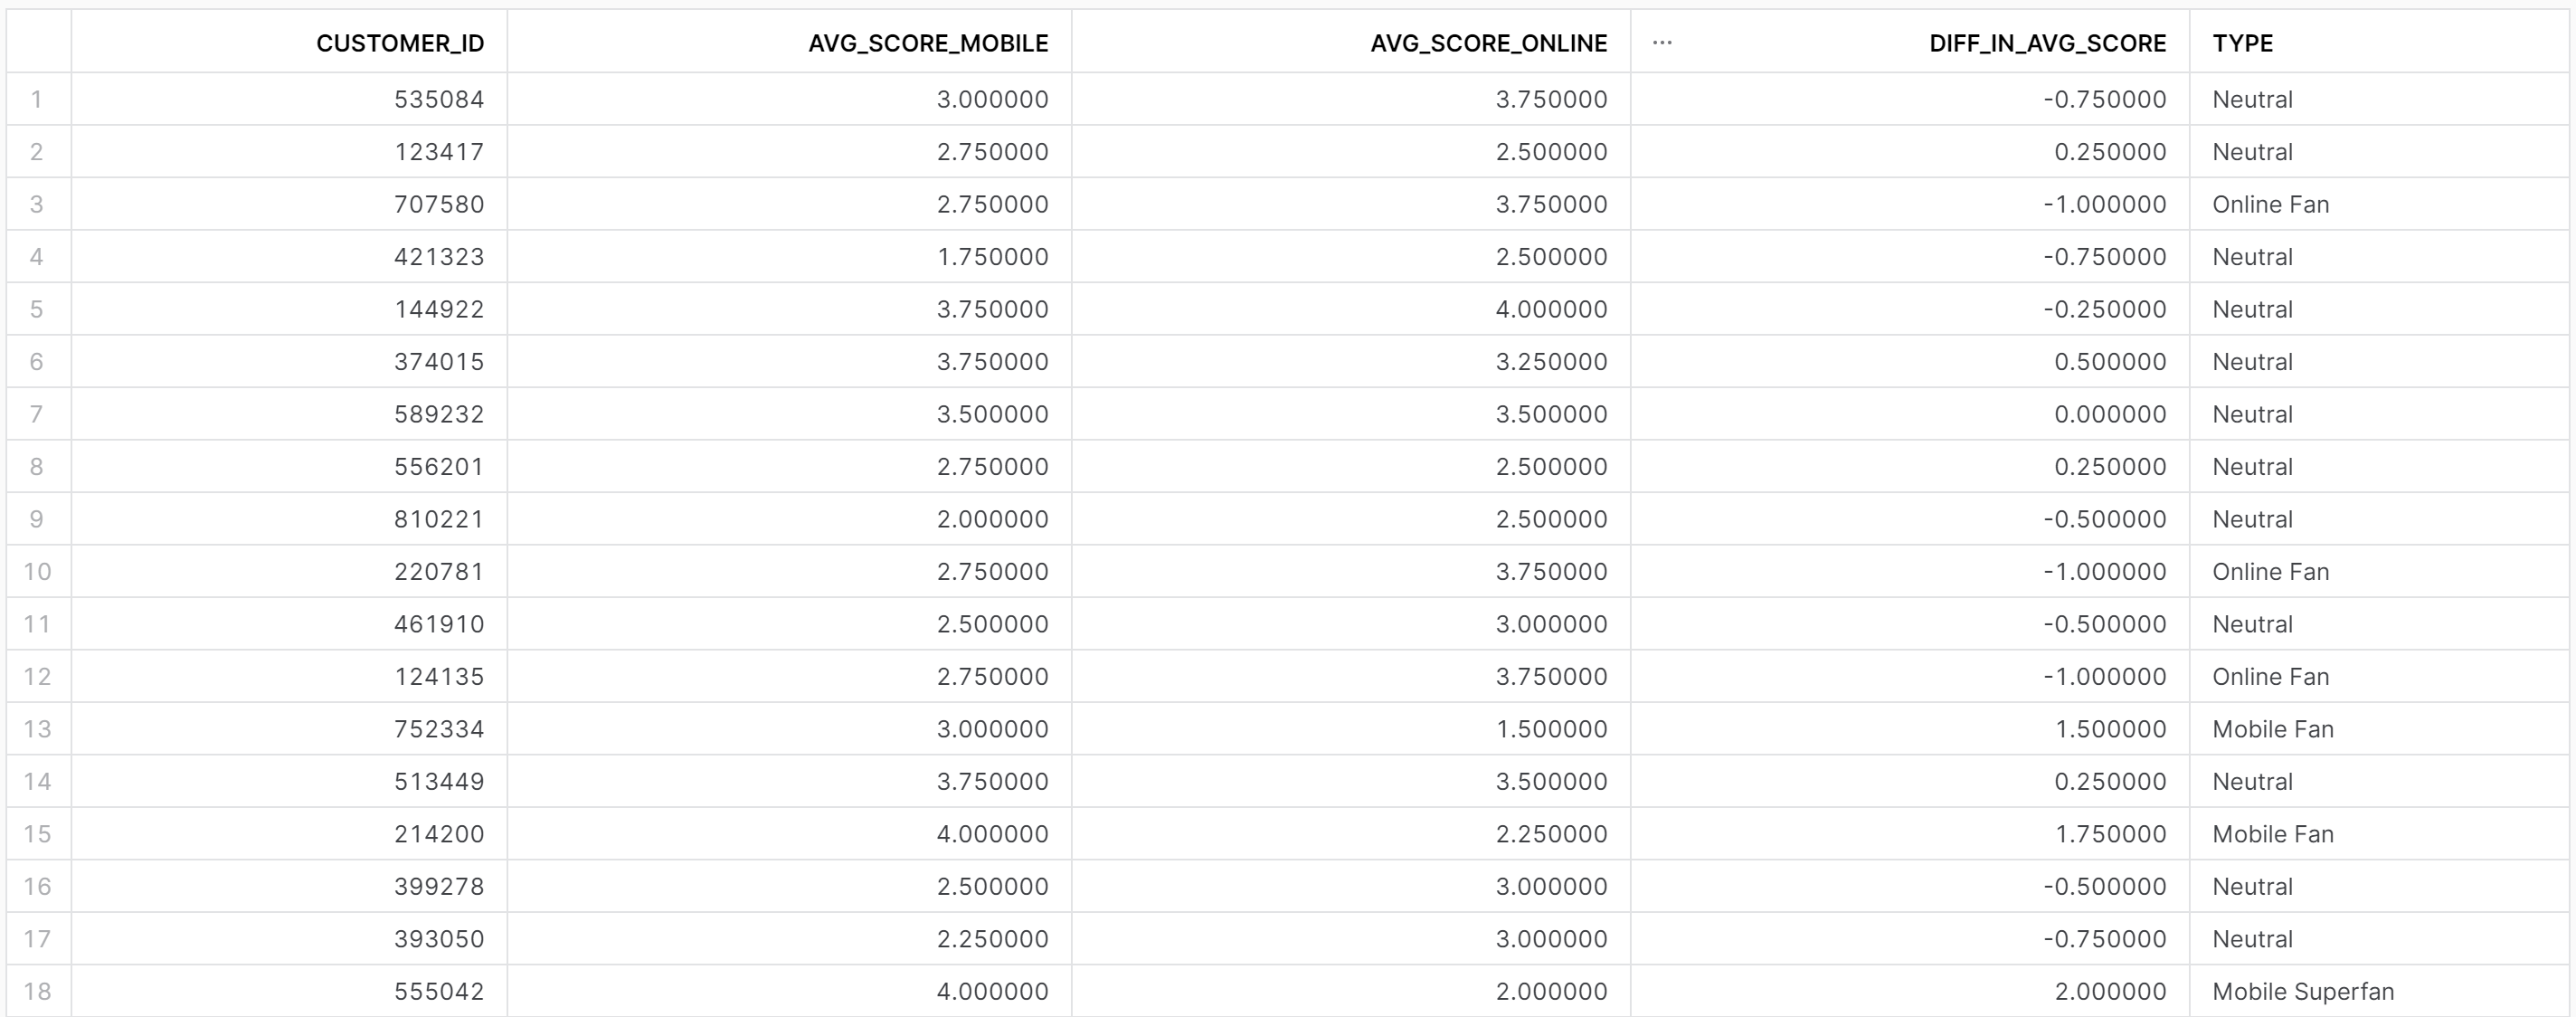
- Finally, to find the difference between the average scores, I created a new column where I minus the Mobile and Online avg. scores.
Here's what the updated table looks like!
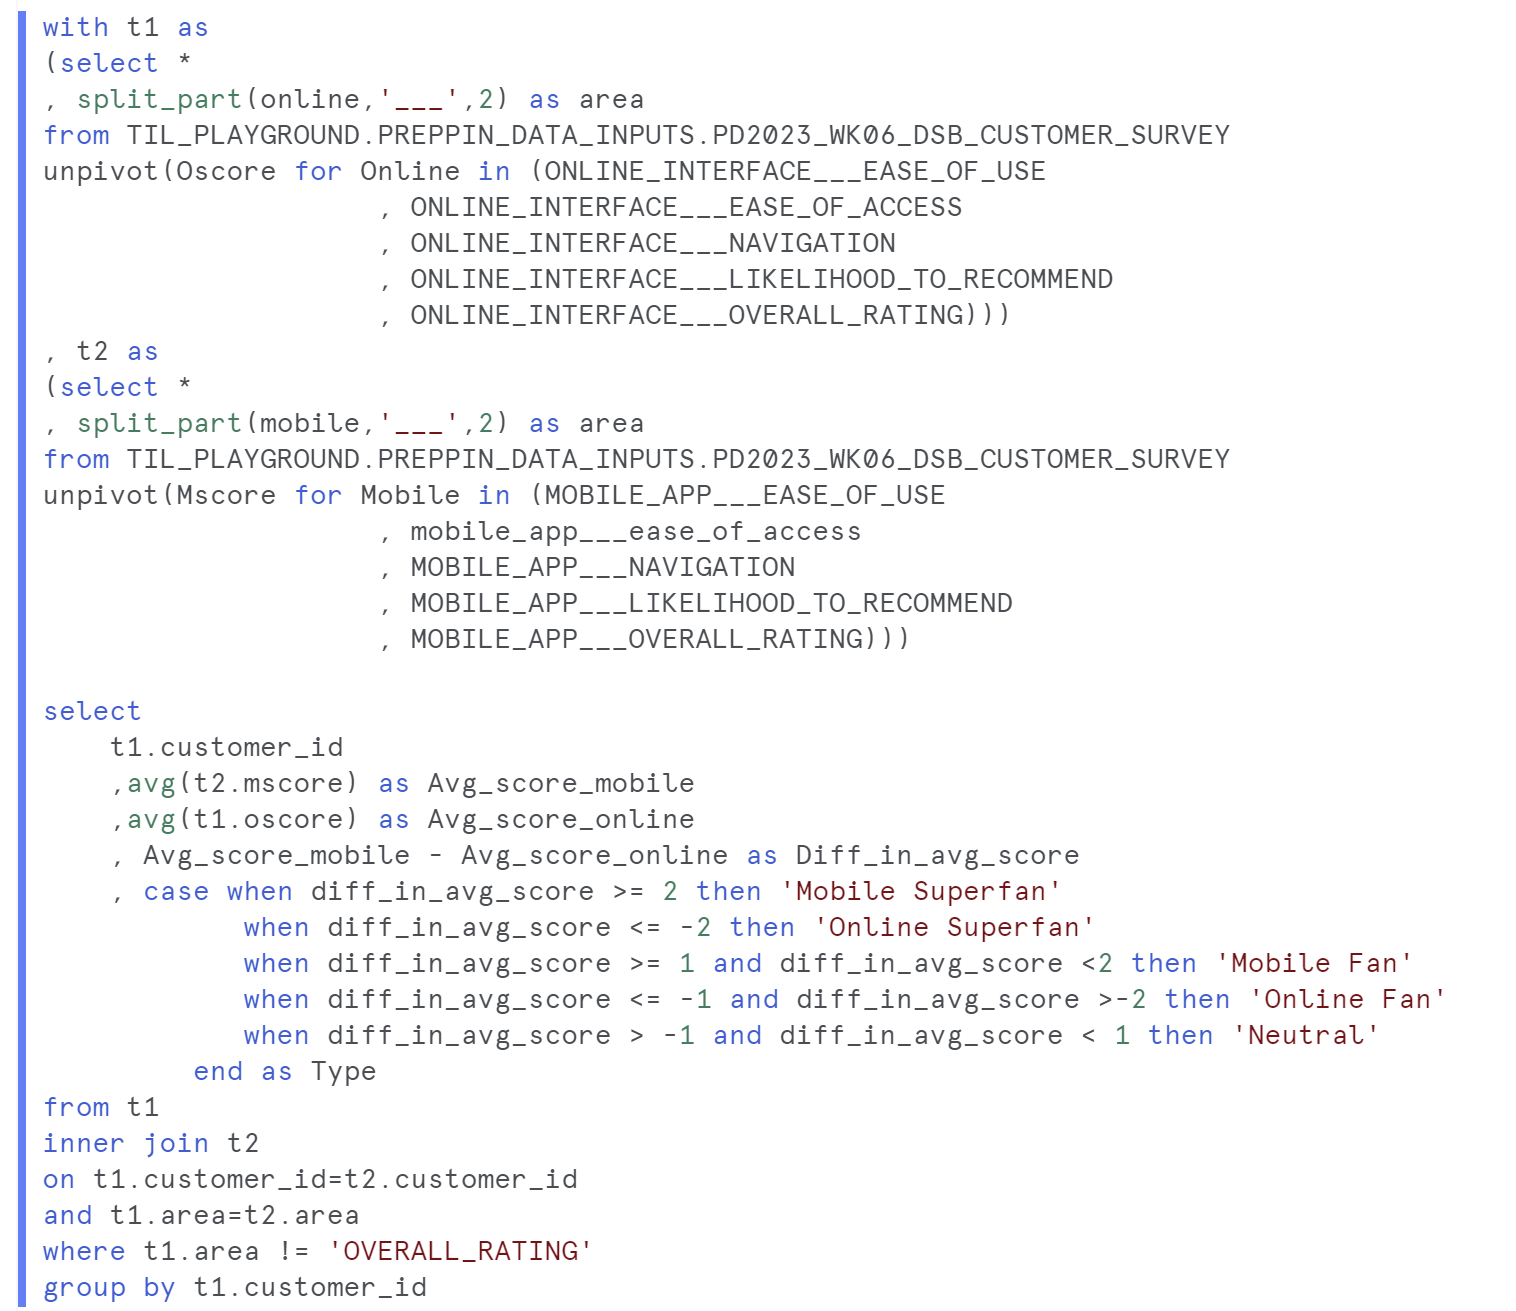
The next part of the challenge requires us to categorise the scores into different groups:
- If the difference in avg, score is above 2 or more, they are a Superfan of the Mobile app.
- If the difference in avg, score is between 1 and 2, they are a fan of the Mobile app.
- If the difference in avg, score is between -1 and 1, they are a neutral between the Mobile app and Online Interface.
- If the difference in avg, score is between -1 and -2, they are a fan of the Online Interface.
- If the difference in avg, score is less than -2, they are a Superfan of the Online Interface.
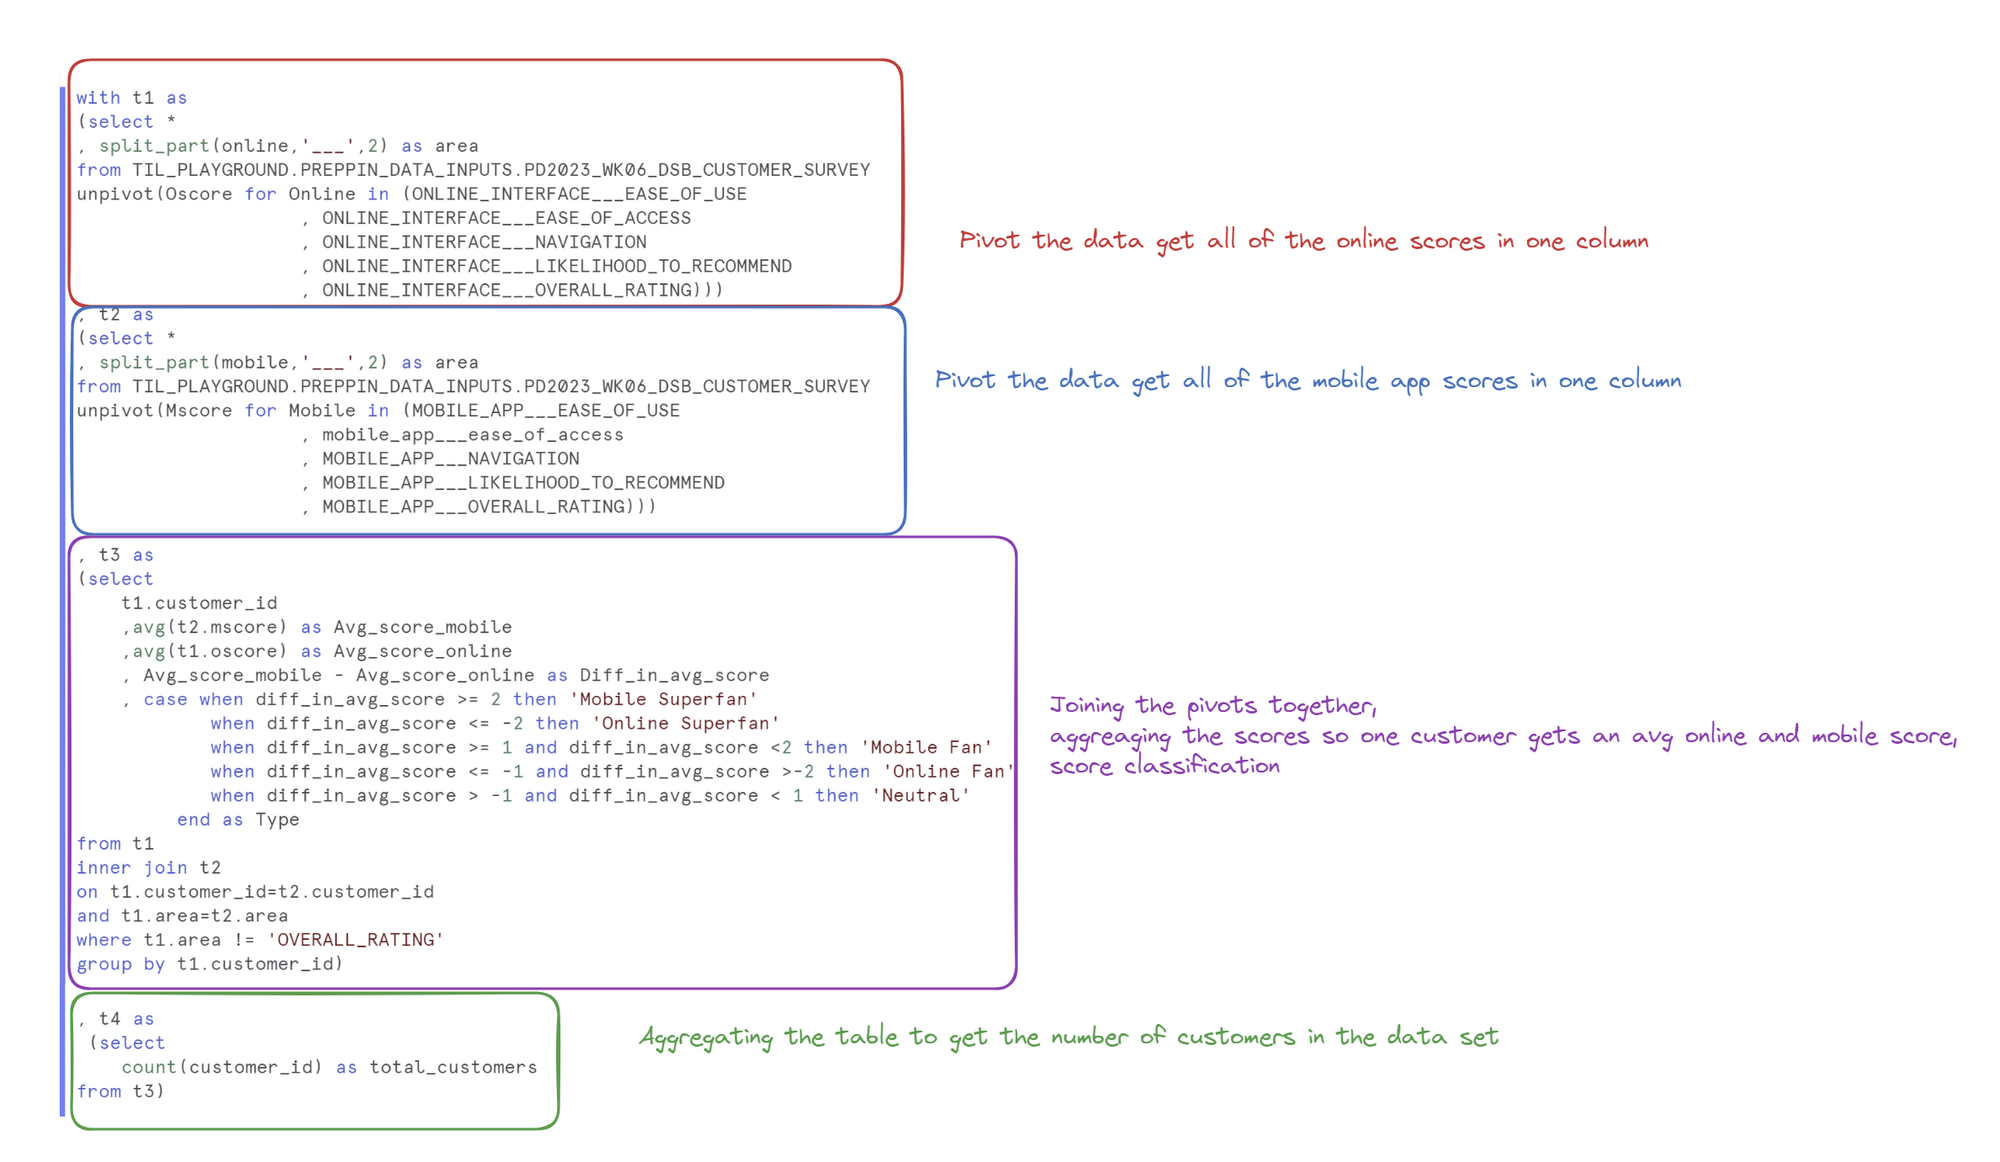
This requires a case statement structured as follows.
We now have a new column classifying each Customer ID!
The final requirement of the challenge requires us to aggregate the data again to see how many customers are in each category, then calculate the Percent of Total customers in each category, rounded to 1 decimal place. The requires additional CTEs.
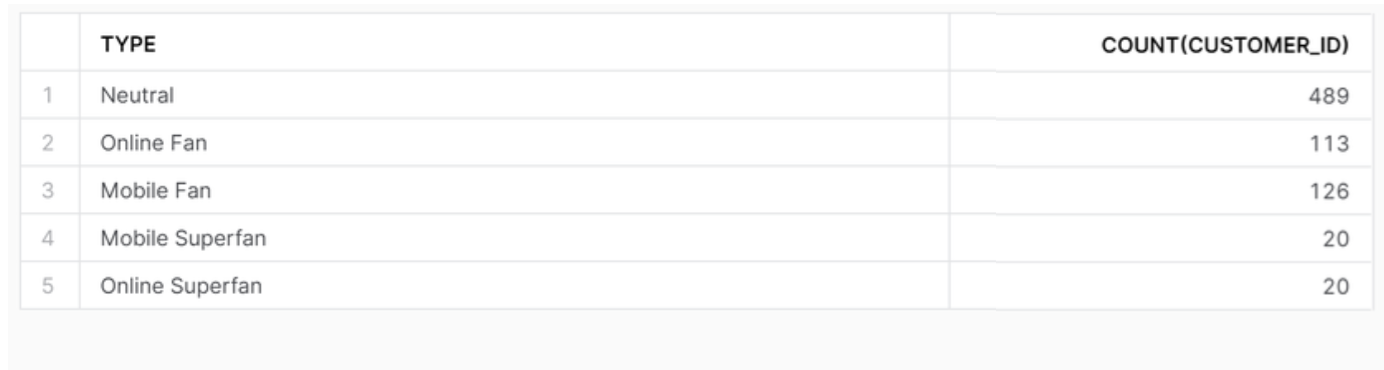
First we put the last section from before into a CTE labeled t3. And we now aggregate t3 to group by the different category types, thus we should only have 5 rows. We selected the type and the count of customers, then grouped by the type.

The table should now look like this!
To calculate the Percent of Total customers in each category, we need to find the total number of customers and divide that the COUNT(CUSTOMER_ID) in the table above.
To do this we need one more CTE.
The CTE (labeled t4) aggregates t3 to give us one number, the total number of customers in the data set.
Finally, we want to join the TOTAL_CUSTOMERS number on the every row of the data in t3. Thus we do a join with t3 and t4, using the syntax inner join t4 on true mean we join the total number of customers on to every row in the t3 table.
This allows us to do a division, rounding to 2 decimal places and concatenating a % using (||).
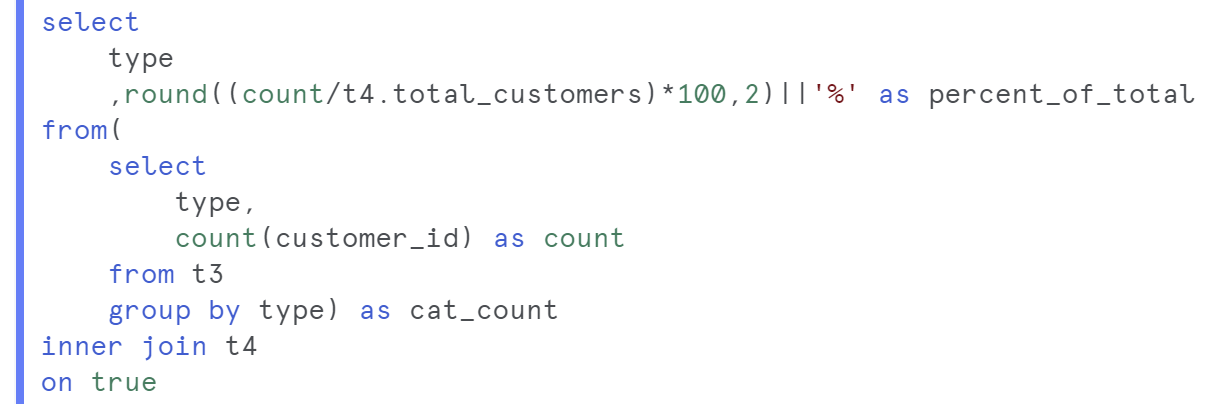
This final output is:
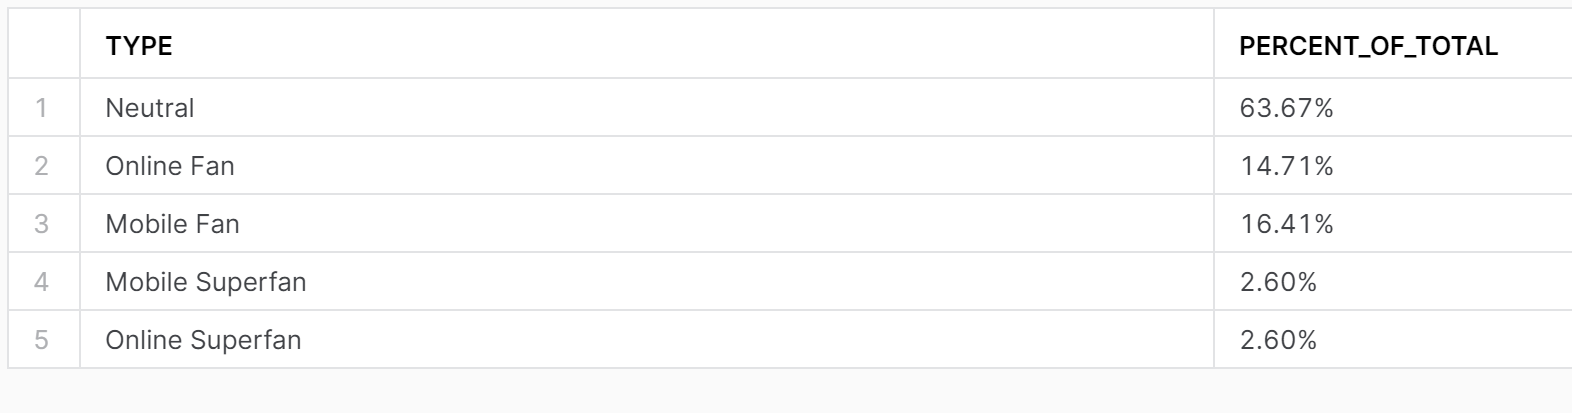
And that's it! This challenge has been useful to practice joins, pivots and CTEs.