


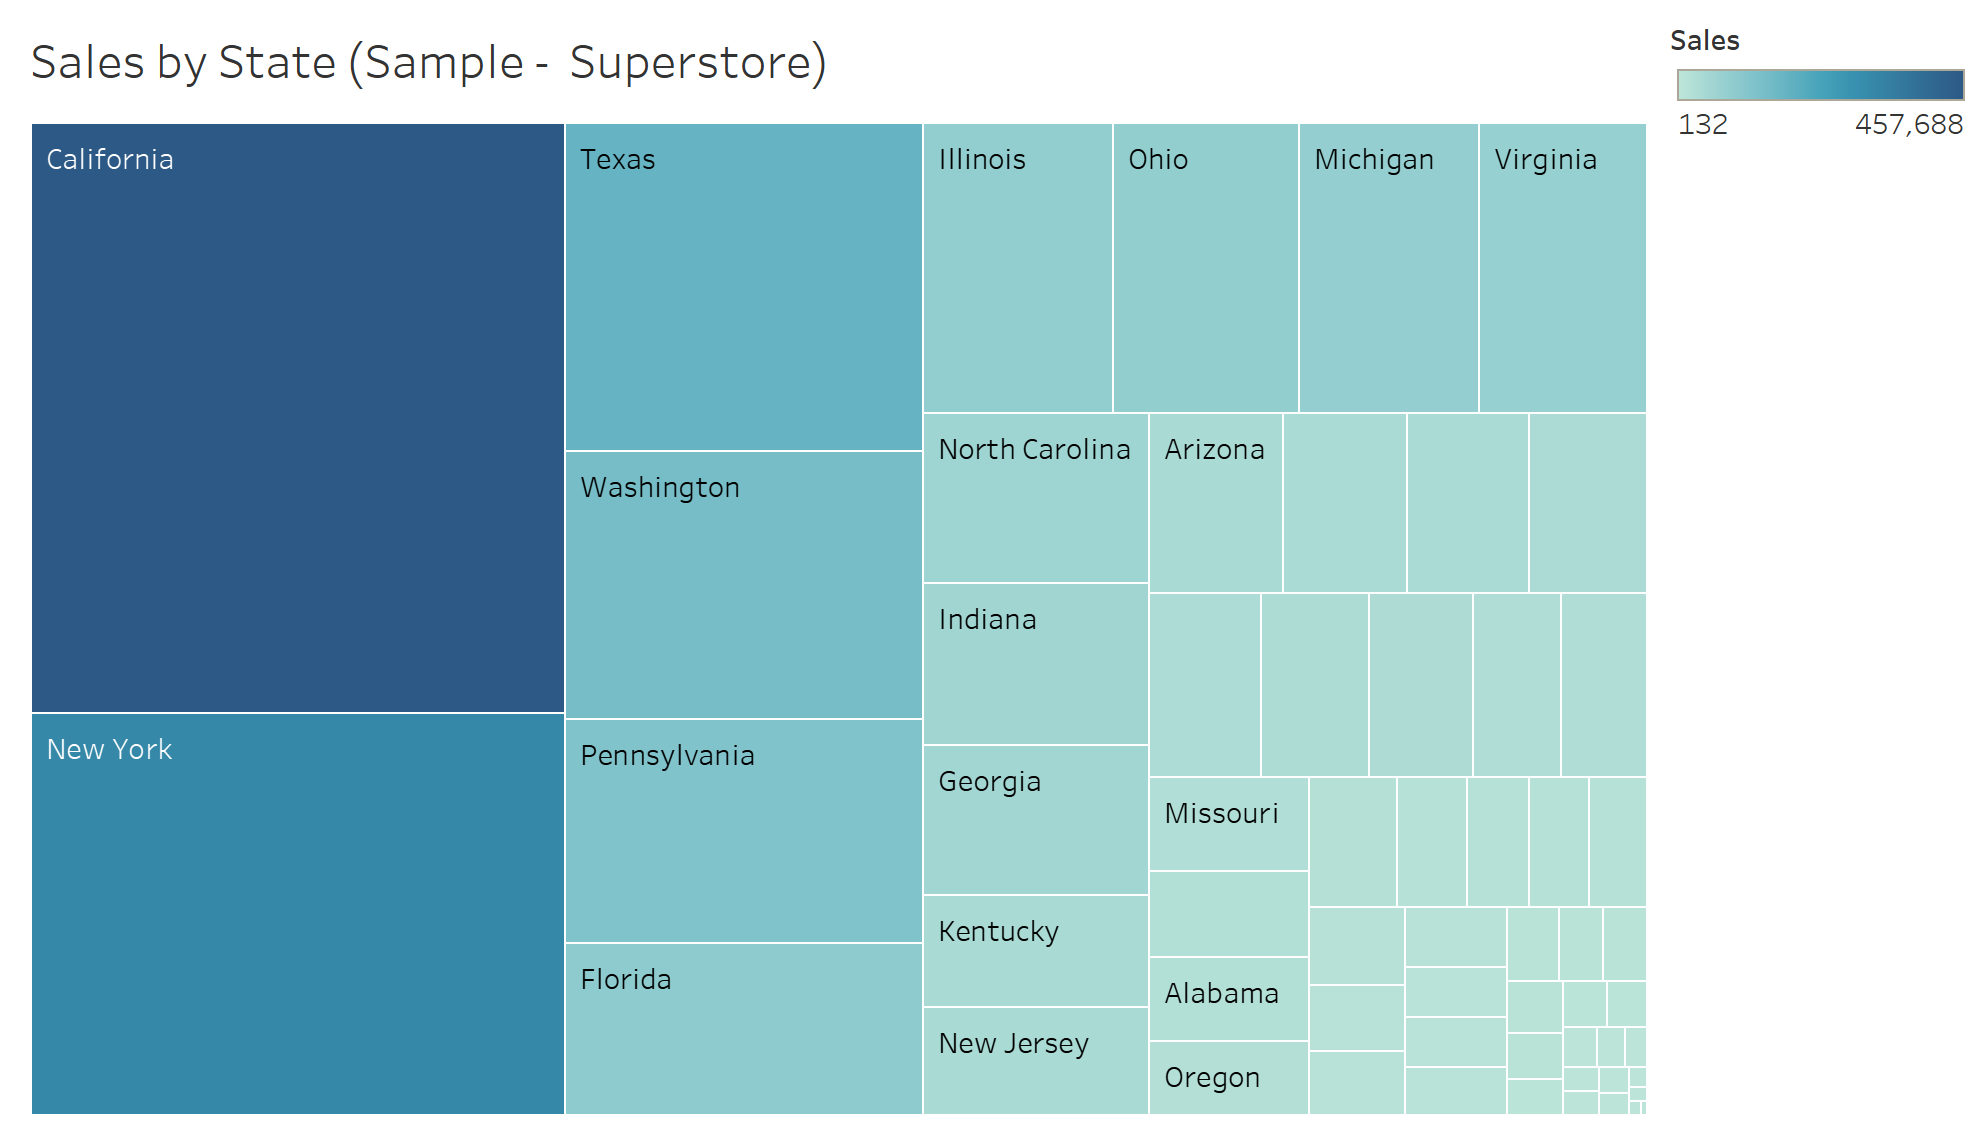
Treemaps serve as a means to visualize complex hierarchical data, offering a useful way of displaying categorical information through area size, enabling the reader to understand and compare different categories in a part-to-whole relationship.
...But, to be honest, I used to detest Treemaps. Each time I encountered one in a dashboard, I would squirm. They appeared cluttered and messy, and, in some cases, my perception was accurate.
An immediate issue with Treemaps arises when dealing with too many categories. This makes the Treemap challenging to read as the segments become so small, resulting in information being truncated or removed. Additionally, like many other chart types, the human eye can struggle to detect minor differences in area sizes and intensity of colour.
This led me to believe that Treemaps with a high number of categorical fields aren’t useful in visualising data. However, when viewed from a different angle, they can be a great way of providing insights into complex data!
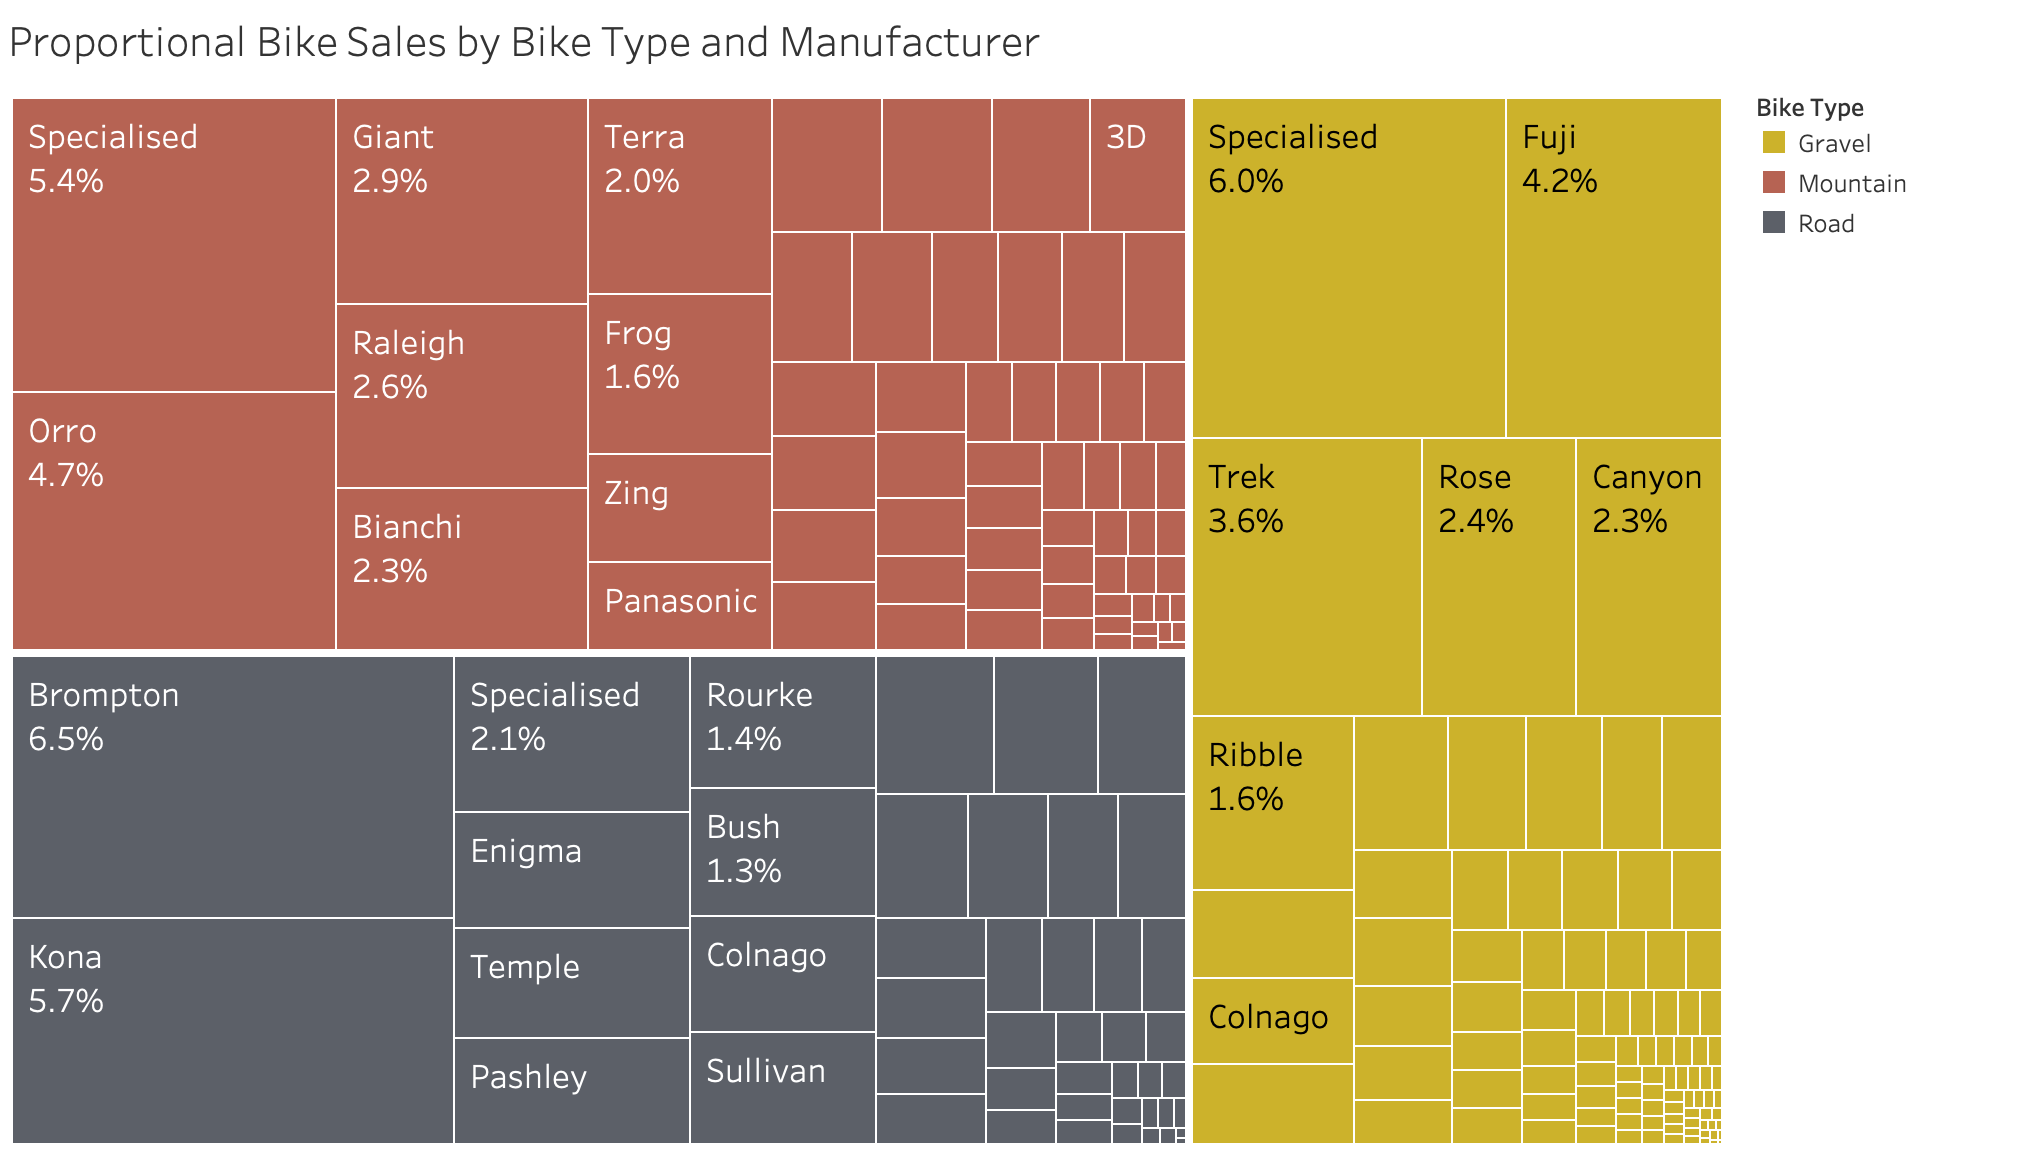
Examining the Treemap above, we observe bike sales for a bike shop ordered by bike type and manufacturer.
At a glance, we immediately understand the distribution of bike types (Gravel, Mountain, Road), which is roughly equal in terms of sales for the store. We can also identify the top manufacturers for each bike type and their percentages. This information proves valuable for bike store managers to determine the most popular manufacturers.
While this offers a general analysis, shifting the context to business operations unveils more insights. Store managers, for instance, want to know what isn’t popular. In the Gravel bike category, numerous extremely small sections constitute a significant proportion of Gravel bike sales.
From this insight, we could advise the business that they might be better off discounting these smaller manufacturers to save costs without impacting sales. In the past, I would have completely ignored the extremely small portions of the chart and assume it was just clutter.
Like most aspects of data visualisation, the best use-case for Treemaps depends on the type of data available, the audience as well as the goal of the visualisation. However, when the correct context is aligned, Treemaps can become an invaluable tool for examining hierarchical data!