


Hi all! This week we have gotten stuck in with Power Query and Power BI, where we approached a bit of a roadblock in Power Query - learning how to count the number of distinct values as an aggregate for a given field!
In the grand scheme of things, this may not be the most useful tip as it is something that can be done with ease in Power BI - BUT I'm writing this in the given chance that someone 0ut there needs to do this. HOWEVER, if you're new to Power Query, or are hoping to get your head around how it works a bit better (particularly aggregate functions).
For context, each record is showing an individual item for each order done, which looks as follows:
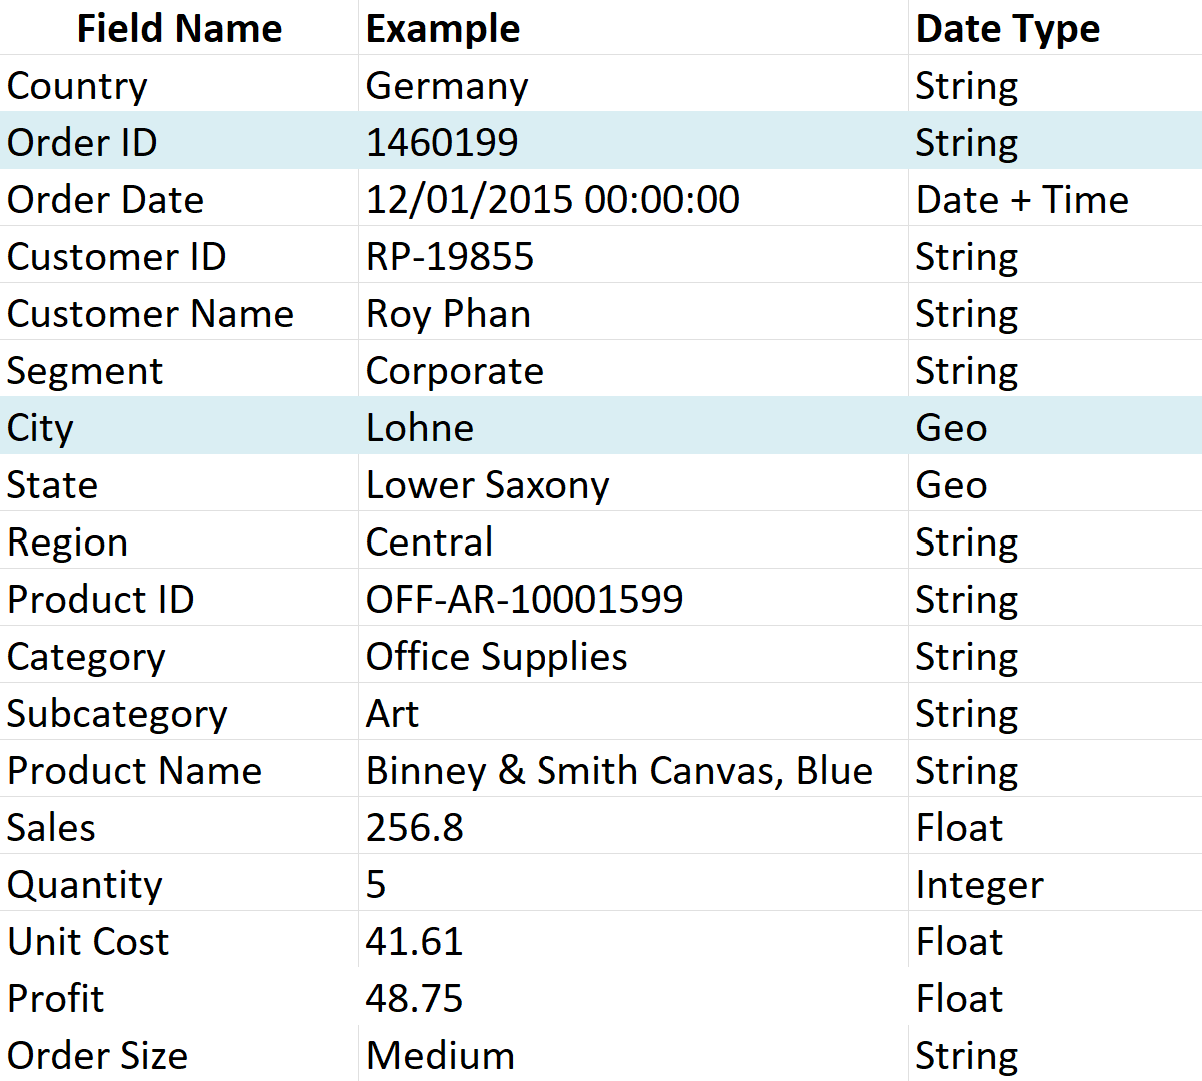
(NOTE: If you're particularly observant, you would have noticed that the data type for order ID is a string even though the example is an integer - this field had been initially cleaned to solely contain numbers which is why Power Query had looked at it like a string! It doesn't really impact any of the analytics as these aren't measurables).
The fields highlighted in blue are key for this walkthrough, so its most important to understand what these mean. As each record is looking for a specific item within someone's order, its also key to understand that the Order ID field is repeated across rows, as people will have different items under the same order.
So, what do we want from this?
Here, I would like to see the number of different orders that took place in London. The process for this is as follows:
STEP 1:
Filter out your [City] field so you only see orders in London.
STEP 2:
Create an aggregated field (known as a group function in Power Query, located under the "Transform" pane) which groups by your [Order ID] and [City] fields and uses the measure Count Rows (I named this field "Counting Rows").
At this point, "Counting Rows" is showing the number of different items that make up one order, as these have been grouped by your separate Order ID's. As this stage now shows each Order ID made in London, so we just need to count the number of rows again to identify the number of unique orders!
STEP 3:
Create another group which groups under the field [City] and uses the measure Count Rows (I named this new field "Distinct Orders"). You should see two columns where the field "Distinct Orders" will now tell you how many unique orders were made in London!
Tip: When applying this method, first group your data at the level you want to count unique records to ensure each record appears only once. Then, aggregate again by the broader category you want to summarize.
Happy Counting!
H