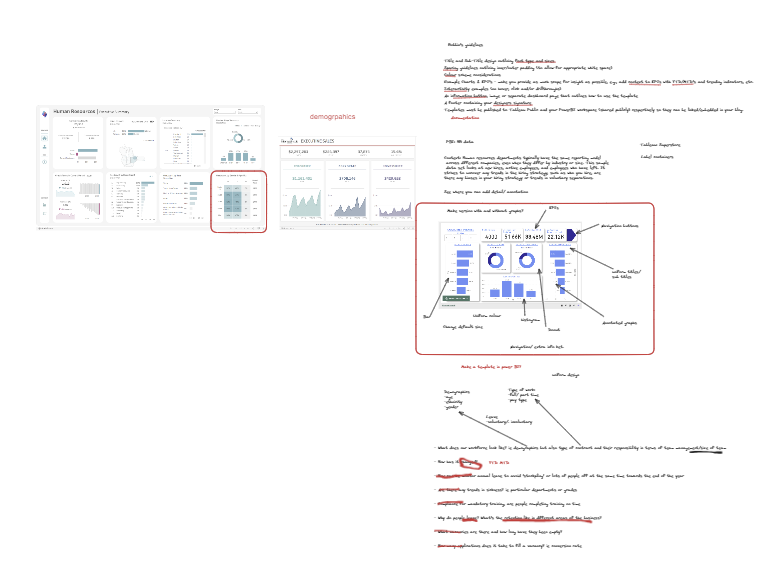
It’s day 2 of dashboard week for DS42, and that has meant templates. We were tasked with making 2 dashboard/ report templates, 1 for a HR in Power BI, and 1 using the superstore data in Tableau. Both of which need to be uploaded, and supplemented with a plan, a scope, and a blog… for 3:30pm!
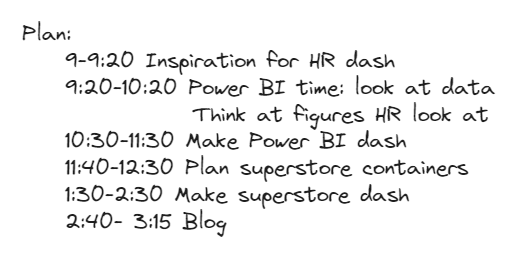
My plan for timings really came in handy today, and I kept referring back to it, to keep me on track.
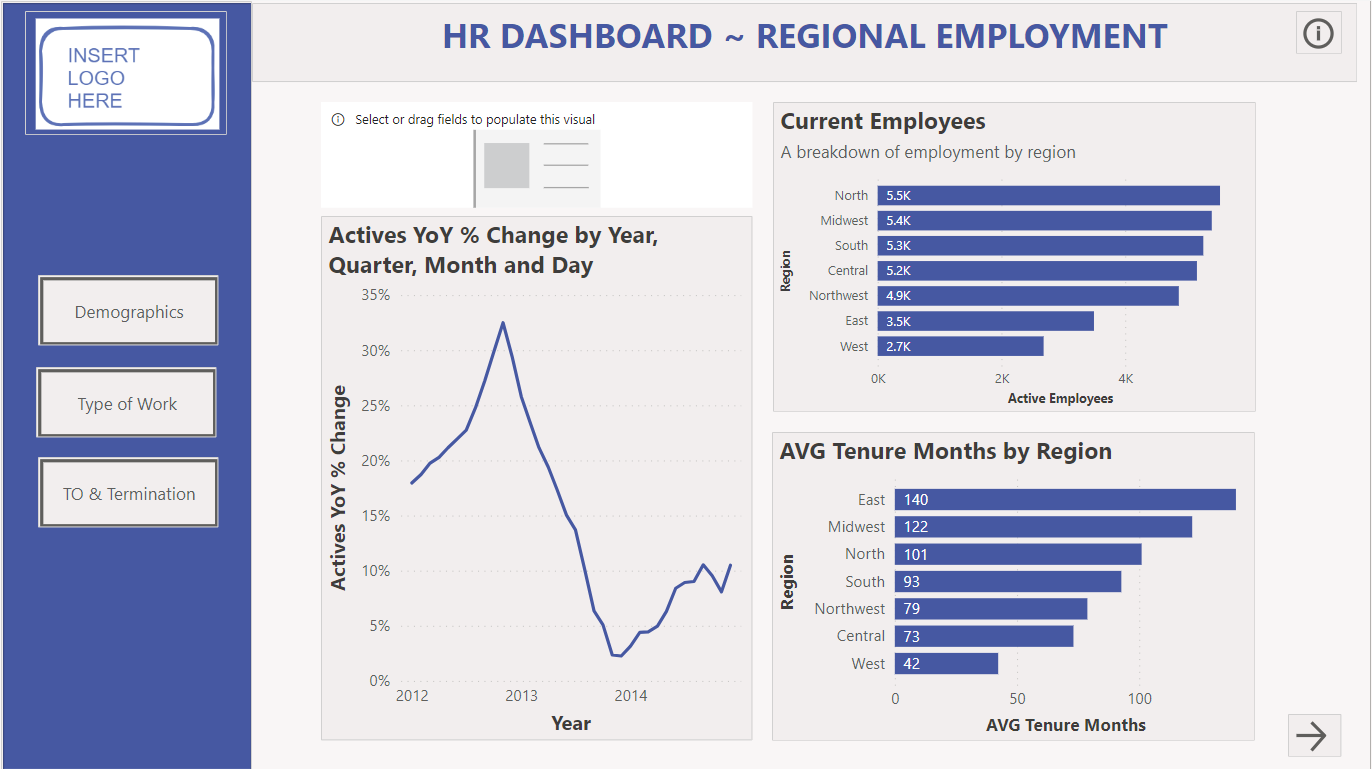
Compared to Tableau (which I used yesterday), I was a bit rusty in Power BI, so I prioritized this template, whilst also making sure I set myself a hard deadline, so I didn’t pour over into my Tableau time. This was useful, because I definitely wanted to keep going. The navigation and info buttons are a nice touch in Power BI to orient you around the report you make. I also really enjoyed the HR dataset I was provided, and will definitely use it in the future to for more dashboards. Below you can see my Power BI report, from inspiration, to finished product…
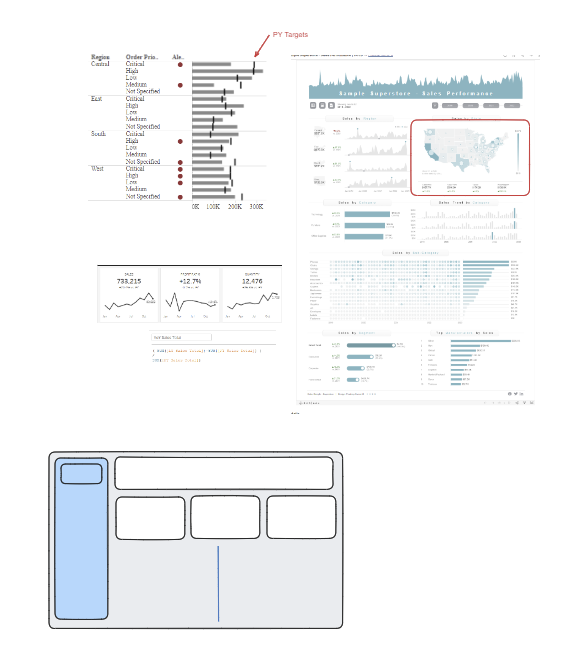
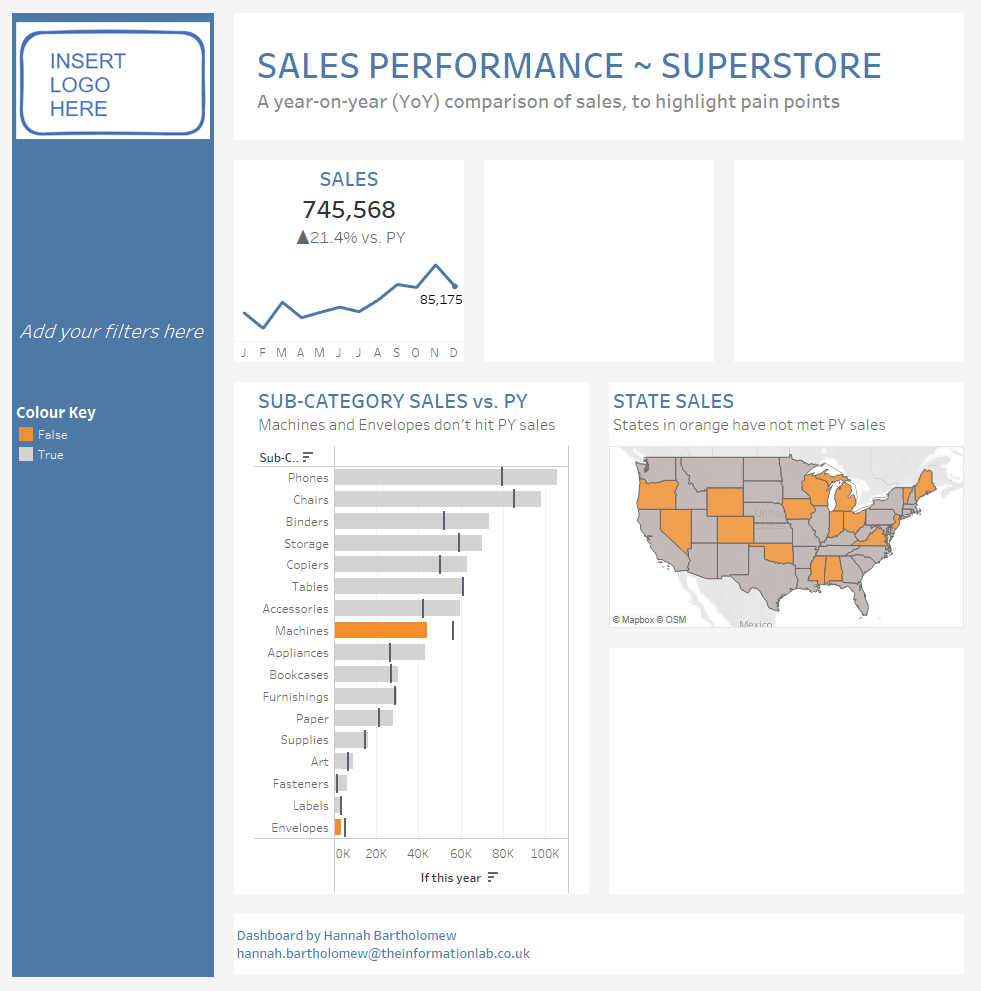
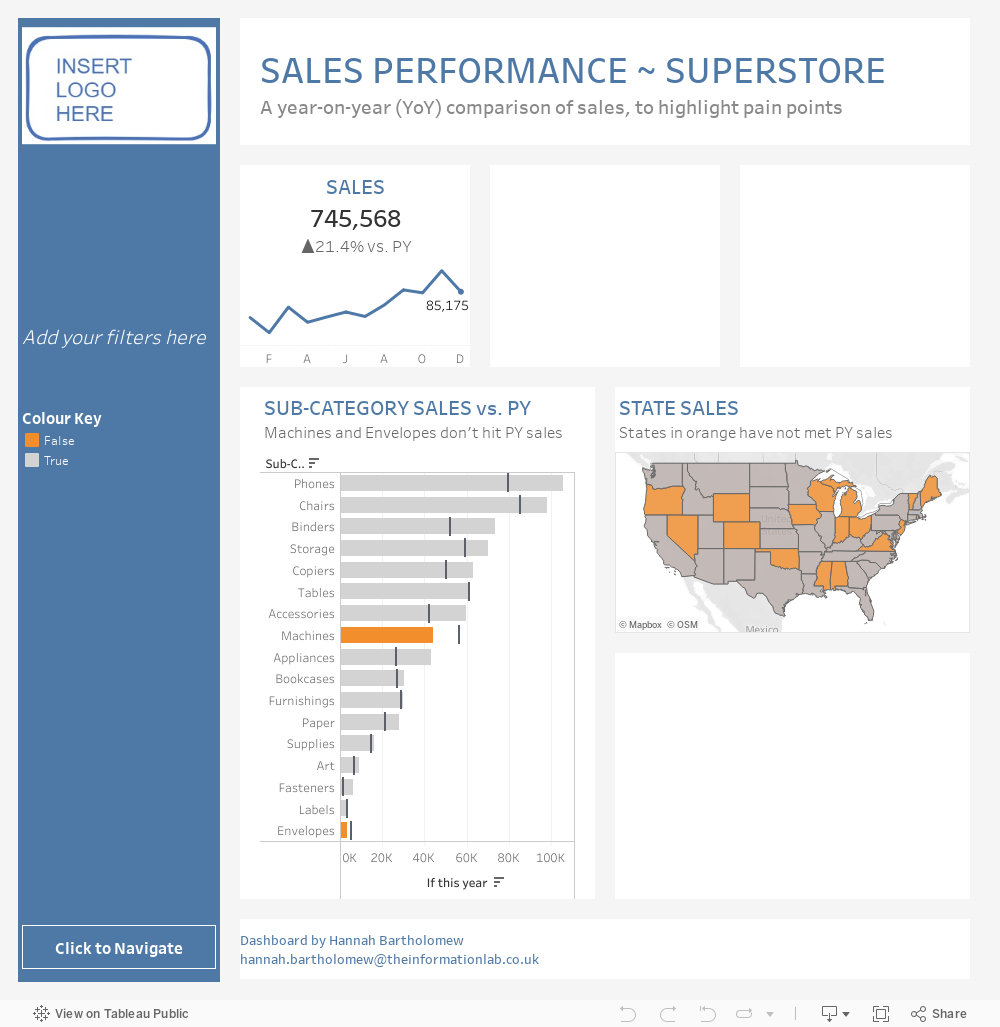
I (actually) had good fun with my Tableau dashboard… I think it’s the nostalgia of the superstore dataset. It meant I didn’t need to spend as much time finding new fields or exploring which was very helpful. I based my dashboard around year-on-year (YoY) sales. Take a look at my inspiration, to finished product...