


Creating a data model in Power BI (PBI) can feel unfamiliar if you’re coming from Tableau. This blog provides a clear guide to how the data model in PBI works and highlights key differences compared to Tableau.
What is Data Modelling?
Data modelling is the process of defining how different tables connect and interact, allowing you to transform raw data into a structured output. A well-built model will ensure accurate calculations and a well-performing dashboard.
Key Differences between PBI & Tableau:
- Joins and Unions ≠ Joins and Unions - PBI calls a join a Merge and a union an Append.
- No Logical and Physical layers - Unlike Tableau, PBI does not have a logical layer (where relationships occur) or a physical layer (where Joins & Unions occur). Instead, Merges (Joins) and Appends (Unions) will be conducted in PBI's transformation tool Power Query, which acts as the physical layer. A relationship between two tables can be made in PBI Desktop's model view. This acts as the logical layer.
Key Features of Data modeling in PBI:
- Cardinality - This means determining which tables contain unique values and which include repeat values so that PBI can appropriately connect them. When you relate two tables in PBI, it will automatically set the cardinality between the two relationships.
- We have 'One-to-Many', 'Many-to-One', 'Many-to-Many' and 'One-to-One' cardinalities:
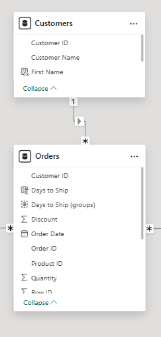
- One-to-Many - For one row in Table A, we have many rows in Table B. This is the most common type of cardinality, and generally applies from a dimension table to a fact table. There will be many rows in the fact table for each row in the dimension table. Like in the example here whereby we have multiple orders (fact table) for every one customer (dimension table):
- Many-to-One - For multiple rows in Table A, we have one unique row in Table B.
- Many-to-Many - For multiple rows in Table A, there are multiple in Table B.
- One-to-One - For a row in Table A, there is a row in Table B. Each table has unique values.
- Cross-filter Direction - This is unique to PBI, and you will notice small arrows between the relating noodles in your data model. It defines how filters work between related tables. It can be either a single direction, or work in both directions. A single direction filter will flow from the dimension to the fact table and is the most common direction. In a 'one-to-many' relationship, it will apply the filter from the 'one' table to the 'many' table. Both direction filters will filter between the two tables. It is common for 'Many-to-Many' relationships, but it is best avoided for others as it can slow down the efficiency of the data model. Luckily, if needed, there is a DAX function called CROSSFILTER which will allow you to filter in both directions within a calculated field, without breaking the data model.
Example Data Model:
When you input a dataset into PBI with multiple tables, it will automatically form relationships between each table in PBI Desktop's 'Data Model View'. It is important to review this as it can often relate tables incorrectly.
The data model view forms these relationships based off common fields. Below is a data model I edited to get an orders fact table, and multiple dimension tables relating to it on common fields, forming a snowflake schema.
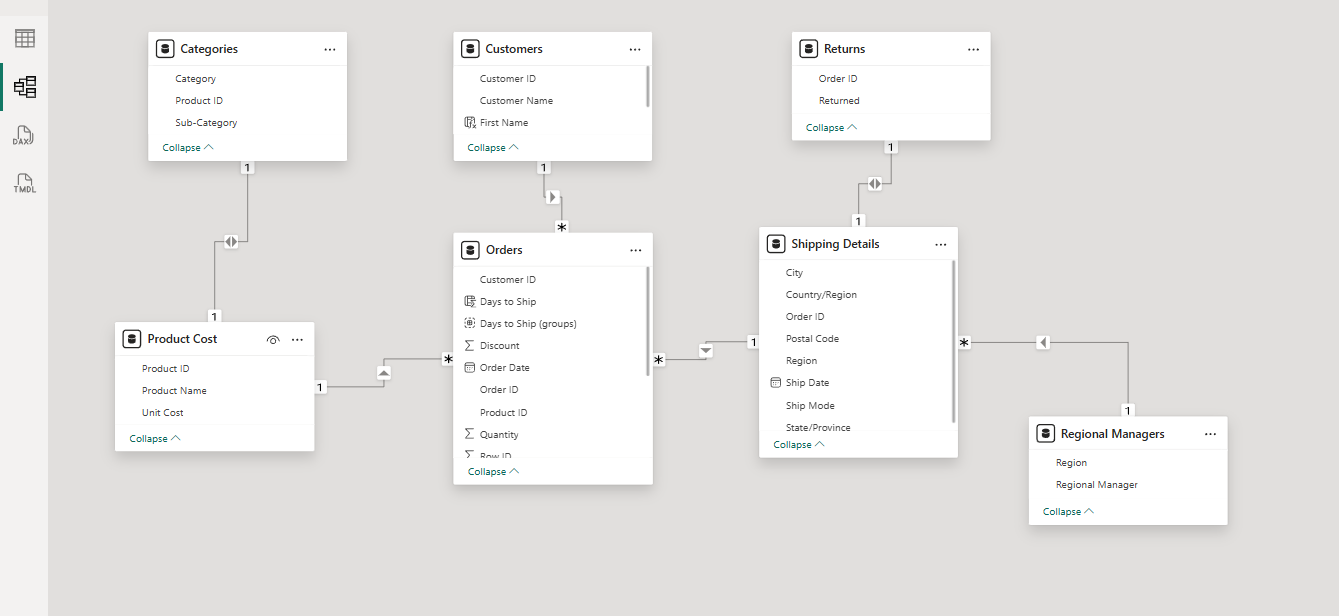
- Each noodle represents a relationship.
- PBI will automatically set the cardinality between each table.
- Arrows on the noodles display cross-filter direction. Single arrow = Single direction. Two arrows = Both directions.
- Drag and drop a field from one table to a matching field on the other, in order to form a relationship.
- A page will then appear allowing you to select the cardinality between the two relating tables.
Final thoughts:
Although the data model in Power BI and Tableau may seem different, the fundamental ideas are the same. Building effective dashboards requires an understanding of relationships, cardinality, and cross-filter direction. Your models will become much more dependable if you grasp these ideas in PBI.