


Today’s project focused on analysing how LEGO football sets have evolved over time, both in design philosophy and visual identity. The aim was to compare early interactive play-focused sets with modern display-oriented stadium builds and to understand how colour usage and set size have shifted across eras.
Defining the LEGO Football Eras
To structure the analysis I grouped LEGO football sets were into three clear eras:
1. Interactive Play Era (1998 - 2006)
This period focused on playable, game-driven sets, like old school Sobuteo sets. Sets were relatively small (100 - 300 pieces) and included functional pitch elements and interactive features such as launch mechanisms.
2. Dormant Era (2007 - 2019)
During this phase, dedicated football sets were largely discontinued. The theme was effectively paused, with football only appearing through individual minifigure collectibles rather than full stadium or pitch builds.
3. Luxury Display Era (2020 - Present)
The modern era marks a shift towards high-end collector sets. These are large-scale stadium builds (3,000 - 5,000+ pieces) designed for display rather than play and with a strong focus on architectural detail and design.
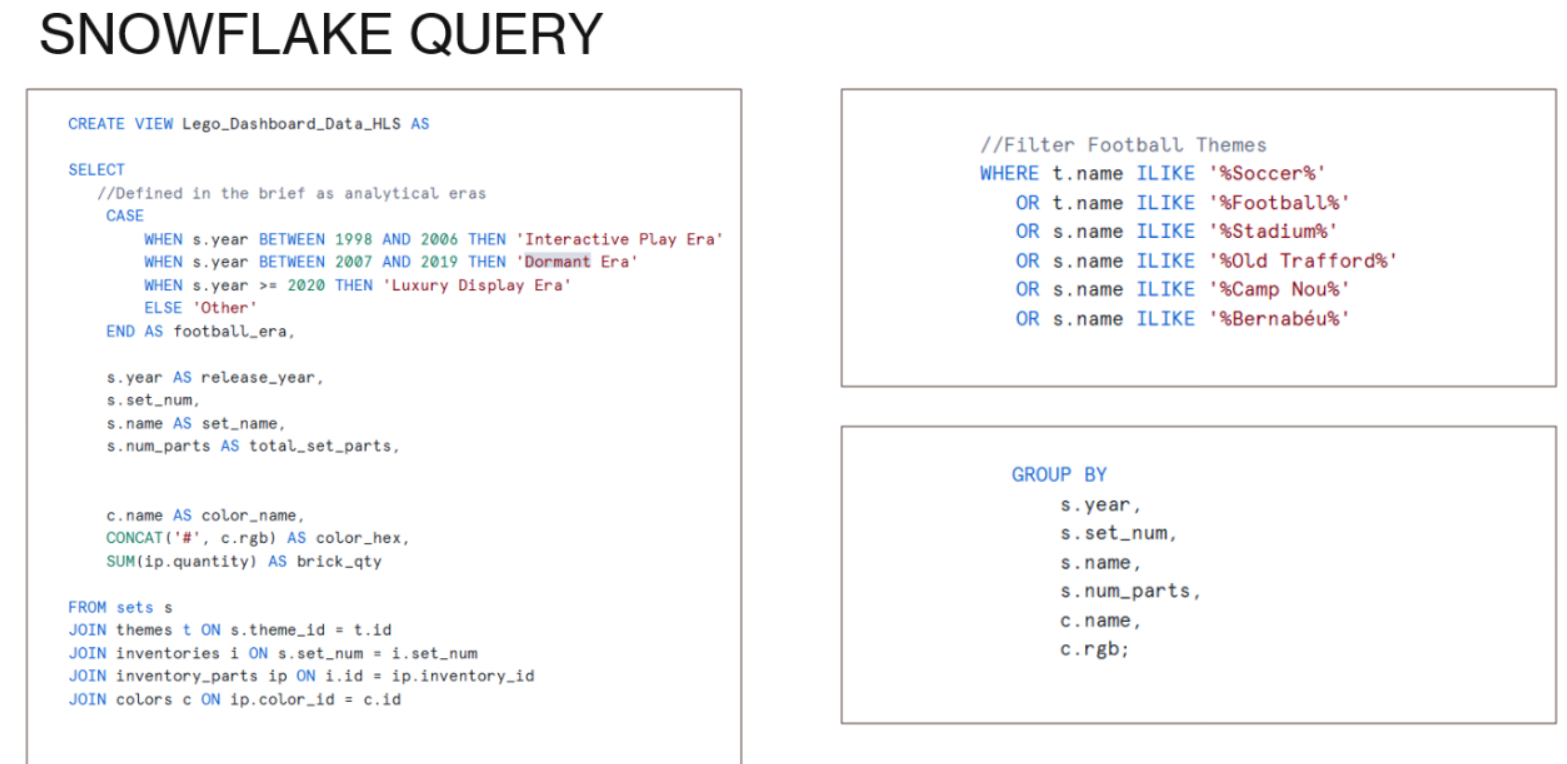
Data Engineering Approach
The dataset was sourced from Rebrickable and processed using Snowflake. I used Gemini to help generate a SQL query that transformed raw LEGO parts data into a structured format.
The query was designed to:
- Filter for football-related themes and stadium sets
- Assign each set to one of the three defined eras based on release year
- Map individual brick colours and link them to official HEX codes
- Aggregate total brick quantities per colour per set
This resulted in a flattened, Tableau-ready table at set - colour granularity, where each row represents a single colour within a set.
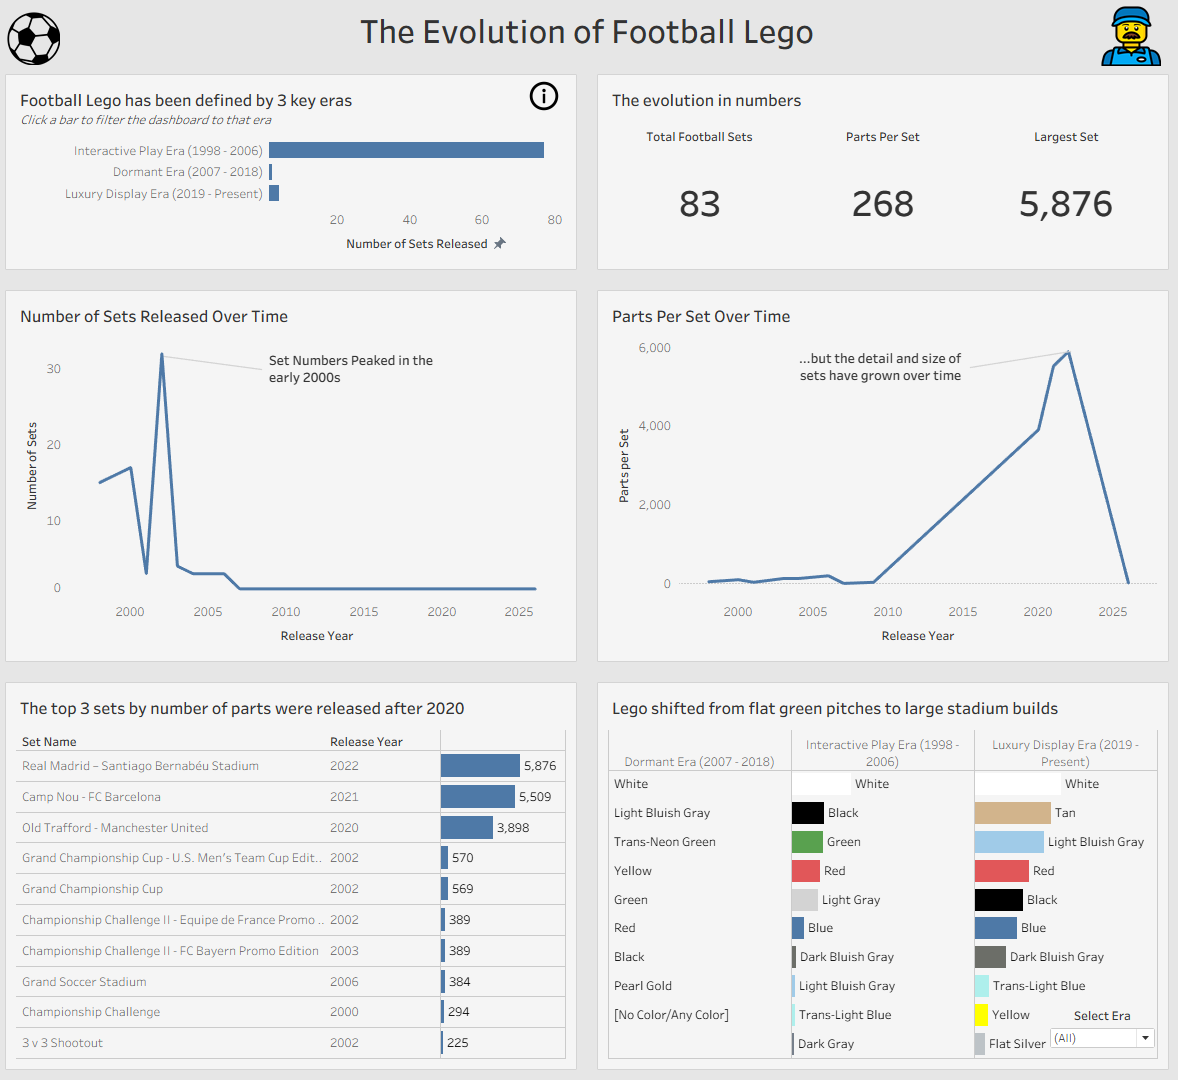
Visualisation in Tableau
The processed data was then connected to Tableau via Snowflake. The dashboard was built to be explanatory and focus on storytelling rather than just raw metrics.
Key areas of analysis included:
- How average set size has changed across eras
- The frequency and distribution of football set releases over time
- Shifts in dominant colour usage across stadium designs
Each visual was supported with insight-led titles to guide interpretation and reinforce the narrative of LEGO football’s evolution.
Final Thoughts
This was a challenging but rewarding end to Dashboard Week. It brought together SQL data transformation and visual storytelling in a single task. The project highlighted how backend data engineering decisions directly shape the clarity and impact of a dashboard and reinforced the value of structuring data before building visuals.