


This blog covers 5 helpful tools in Alteryx and how to use them - Transpose, Crosstab, Unique, Multi-field and Multi-row. To demonstrate each one, I’ll use simple mock datasets generated with AI so you can clearly see the transformations and outputs.
Transpose:
This is essentially a columns to rows pivot.
Key columns = The columns that will be static after the data is pivoted (remain as columns).
Data columns = Columns that are going to be pivoted.
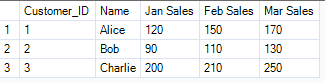
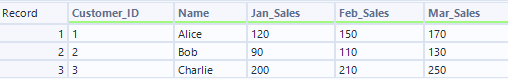
Using the dataset below, we want to use transpose to pivot so that each month's sales becomes a row.
Once you connect the transpose tool to your input data, you will see configuration options on the left:
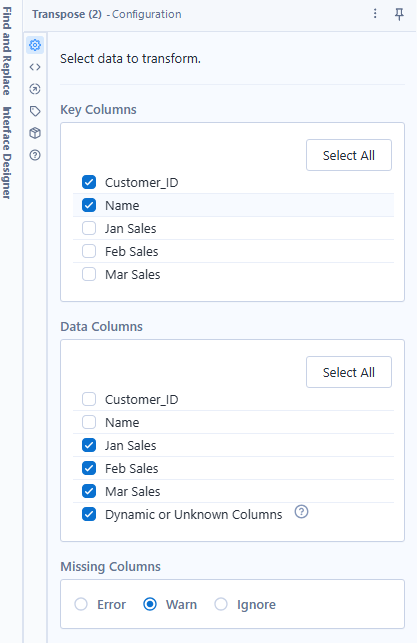
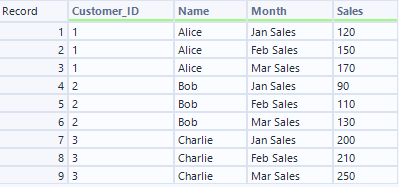
Select your key columns (Customer ID, Name) and your data columns (all the months sales). The output will then look like the longer table below, and you can then use a select tool to rename our new columns to month and sales.
Crosstab:
This is a rows to columns pivot. Using the output from the previous example, we can convert the data back into its original wide format. The Crosstab view is slightly different:
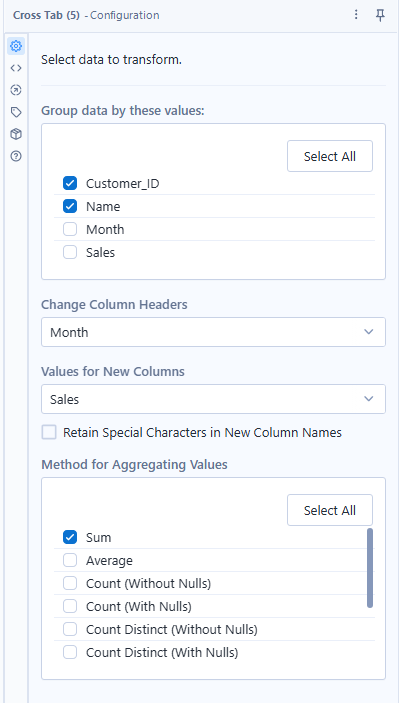
There are 4 key steps in the configuration:
- Group by - what the new columns will be grouped by, in this case it is Customer ID and Name.
- Change column headers - select the field that will be the new column headers (the values in the current month column).
- Values for new columns - what the value within the new months columns will be (the numbers in the sales column).
- Aggregation method - Select the aggregation, which in this case is a sum.
We will then have an output of our old table:
Unique:
This tool will quickly identify duplicated rows within your data. Using the input below, the unique tool will provide two outputs, (unique & duplicate).
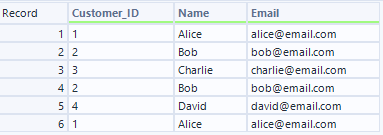
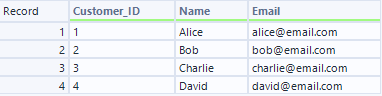
Unique output:
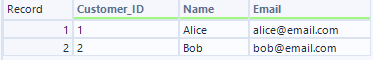
Duplicate output:
This is using all fields as the unique identifiers, but you can also select 1 or multiple fields. It is a very handy tool when cleaning big datasets.
Multi-field:
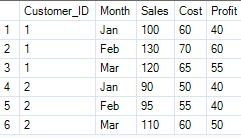
This tool allows you to apply a formula across multiple fields (columns) at the same time. For example, using the dataset below, we can apply a 20% increase to Sales, Cost and Profit with a multi-field step.
Adding a multi-field step next to the input will prompt this configuration view to appear on the left:
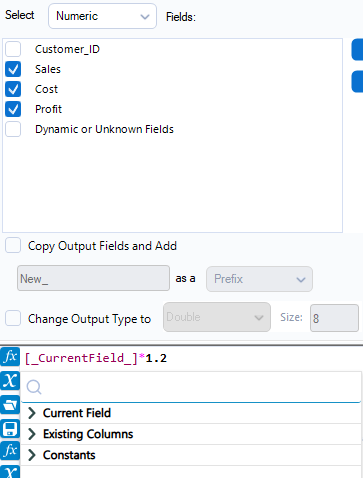
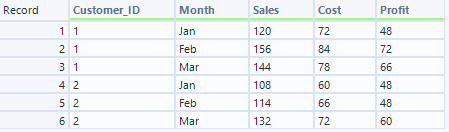
Select the fields you wish to apply the formula to, and then click on the X icon in the pane at the bottom. This will load the Current Field, Existing Columns and Constants dropdown. We can then type in the formula [_CurrentField_] * 1.2. It is important to untick the 'copy output fields and add' box, as this will create 3 new columns instead of just updating the existing table. Our output will then look like this:
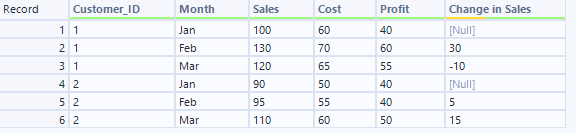
Multi row - similar to filling down in Tableau Prep, this can allow you to update fields based on data from surrounding rows. In this example, I want to find the month-by-month change in sales. After adding a multi-row step, the following view will appear on the left:
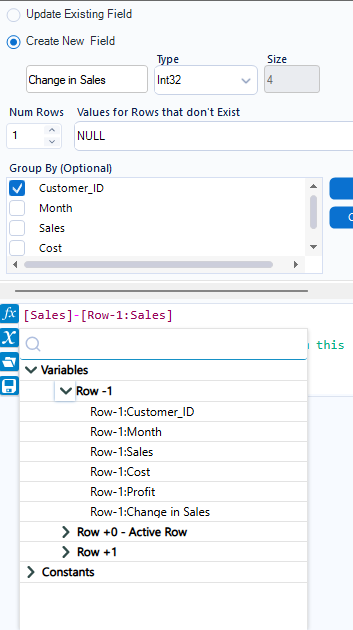
We want to:
- Group by customer ID
- Create a new field called Change in Sales
- Make values for rows that don't exist NULL
- Write the formula: [Sales]-[Row-1: Sales]. This is 'subtract the previous row's sales from this month's sales.
We then get the following output:
Final Notes:
These are just 5 of the many wonderful tools at your disposal in Alteryx, understanding them will significantly help your ability to clean and reshape your data efficiently.