


Aggregation is one of the most important steps in drawing insights from your data. It allows you to turn raw records into meaningful metrics and start answering real business questions. In this blog, I’ll walk through what aggregation is, why it matters, and how to use the Summarize tool in Alteryx to aggregate your own data.
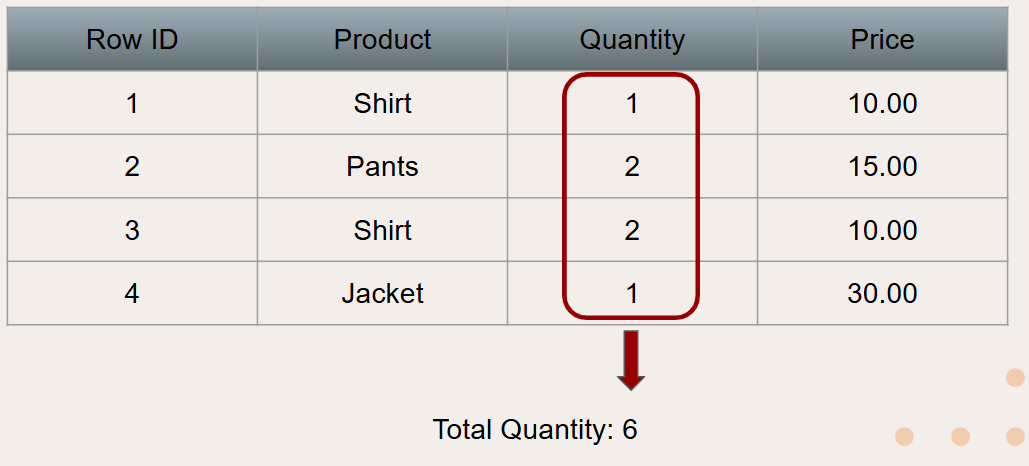
Aggregation is the process of summarizing data over multiple rows. While it might be hard to gather and real insights from one row of data, if you aggregate all the rows into metrics that represent the entire dataset, real meaning can be taken. For example, one might want to know the total quantity of products in the table pictured below. By aggregating the Quantity column and summing all the numbers, this can be done.
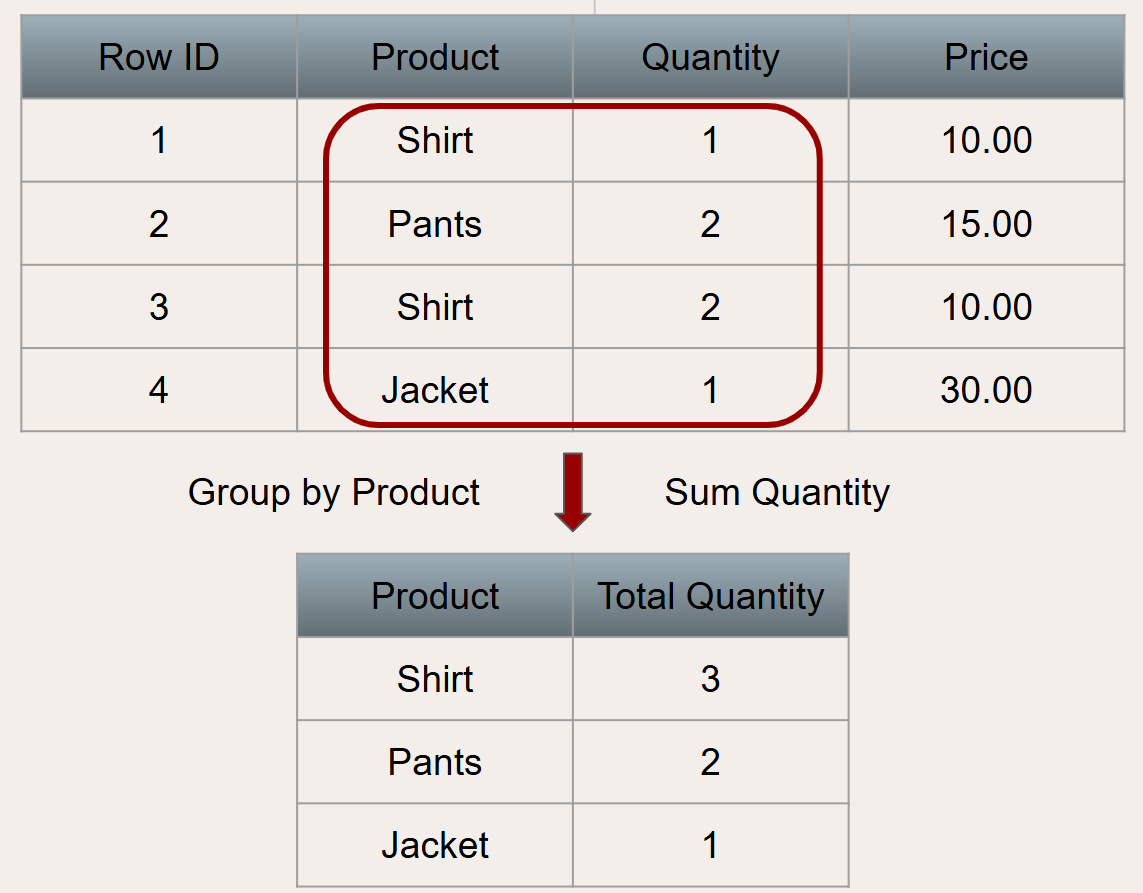
If instead someone wanted to know the quantity for each product, this can also be done with aggregation. Aggregation allows grouping by one or more columns. In the example shown below, aggregation organizes rows with identical values from the grouped product column into summary rows (shown below). Then the same Quantity column summing aggregation can be performed, with the quantity being measured for each unique product.
The process of aggregation is essential for turning data into real insight. By aggregating, you transform individual data points into meaningful metrics that are much easier to interpret. A single row on its own doesn’t reveal much, but when you look across all rows, patterns and trends begin to emerge. This broader view allows the data to tell a clearer story. From there, businesses can start answering important questions, identifying trends, and making more informed decisions based on the overall picture rather than isolated data points.
To understand how this process works in practice, let's dive into Alteryx. In Alteryx, aggregation is done with the summarize tool.

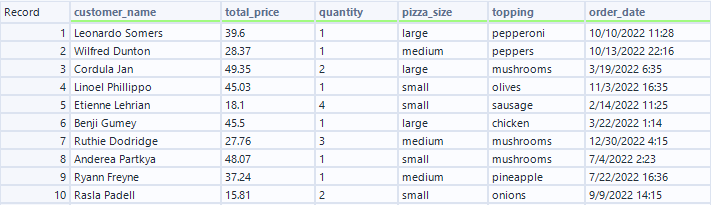
For this example, I'm going to use the tool on a fake pizza store data set. This data looks at pizza orders, with columns for who ordered, the cost of the pizza, how many pizzas were ordered, the size, the topping, and the date ordered.
I'm going to attach the summarize tool to my data as so:
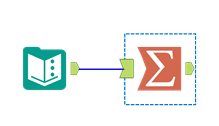
which will give me this screen:
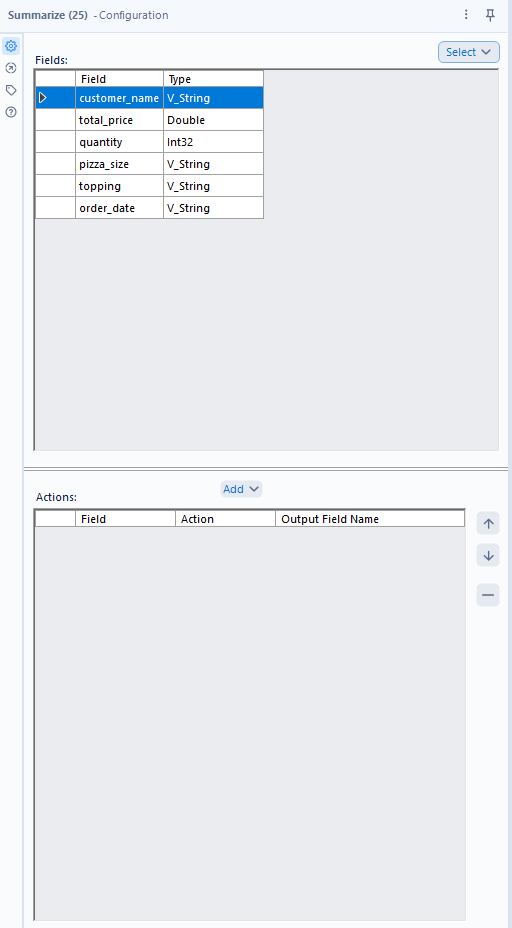
I am now able to click on any of the fields at the top from my data, and click the add button in the 2nd pane. Clicking the add button will bring up this pane:
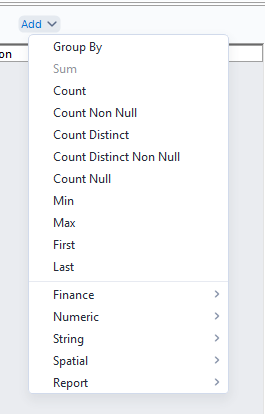
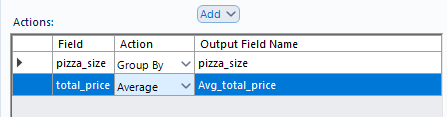
This allows me to either group by the selected field or aggregate the selected field. If I want to find the average cost for each pizza size, it would take 2 steps. Firstly, since I want to look at one row for each pizza size, I need to group by the field pizza_size. Since I want to get the average cost for each, I can click on my total_price field, click add, mouse over the numeric options, and select average. The result will look as so:
When I run the flow, I can get insights into which sizes are typically the most expensive:
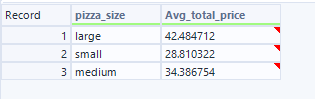
Using aggregation, I was able to extract very valuable information from my dataset quickly and easily. Hopefully this blog gives you the aggregation information you need to help draw insights from your own data!