


Welcome back (or just welcome if you're new) to another one of my 'Back to Basics' blogs! This blog is part of a comparative series I've been writing on fundamental steps in data preparation across the three platforms that we learn during training at the Data School: Tableau Prep, Alteryx and Power Query. Today, we're covering how to PIVOT! (please someone get that Friends reference) from rows to columns and columns to rows. You'll find there are a variety of ways that pivoting is referred to depending on the direction and platform, and we'll touch upon those when we come to said differences, but for now don't get too bogged down by the terminology as they all mean the same thing. It's kind of like courgettes and zucchinis or aubergines and eggplants, they're the same vegetables but one is the name for it in the UK and one in the US (in this analogy, the different countries represent the different platforms if that wasn't clear!). Now that we know not to panic about the jargon, what exactly even is pivoting?
The what and why of pivoting
Pivoting is a way to change the shape of your data. Typically, data is either short and wide or tall and narrow and we're taught that it's most efficient for processing that datasets be the latter (tall and narrow) because that's how computers process. The processing argument is most applicable with larger datasets and not the dataset that I'll be working with today but the concept still stands, and there are often cases where it is easier for analysis to have the data in a particular format as well so reshaping the data is often still worth doing even if the dataset is smaller like mine.
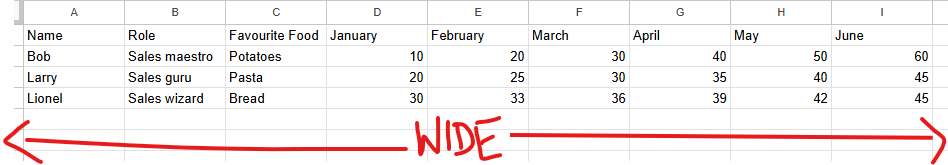
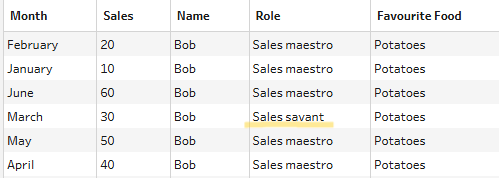
Let's begin thinking about this by going from a short and wide dataset to a tall and narrow dataset as that is the more likely direction you'll be going in. In the example below, I have created a dataset on monthly sales by three employees at a fictional company.
I'd like to find the average sales for each salesperson but how do I do this? I could add up each column one by one and then divide them but this is slow and susceptible to human error. If I used the average function which works down a column rather than across a row, that would be much easier. But then I need to get my data from being 1 row and 6 columns to 6 rows and 1 column. How do I do that? By pivoting, of course.
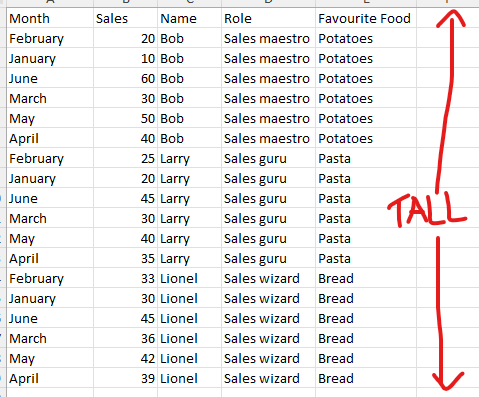
However, if I start with the dataset below but I want to look at how average monthly sales have changed between January and June, it would be a lot easier to have the months in columns to average their sales and then compare those values against one another. How do we achieve this multi-row to multi-column transformation? Through pivoting!
Now that we have a better idea of what pivoting is and why we might perform a pivot step, let's learn how to complete the step in each software!
Tableau Prep
Pivot (Columns to rows)
Pivoting is one of the core steps that you can add to your workflow in Tableau Prep so once you load in your data, add that to your workflow.
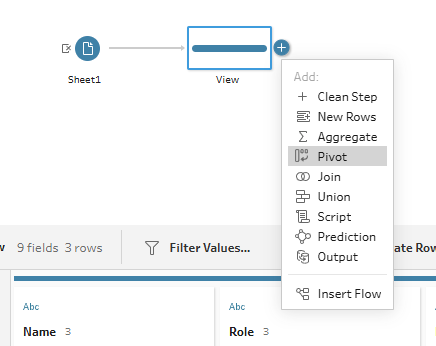
Once your pivot step is added, you'll get a pop-up window appear in your profile pane where you configure which rows/columns you would like to pivot. We're starting with a columns to rows transformation so the set-up looks like below.
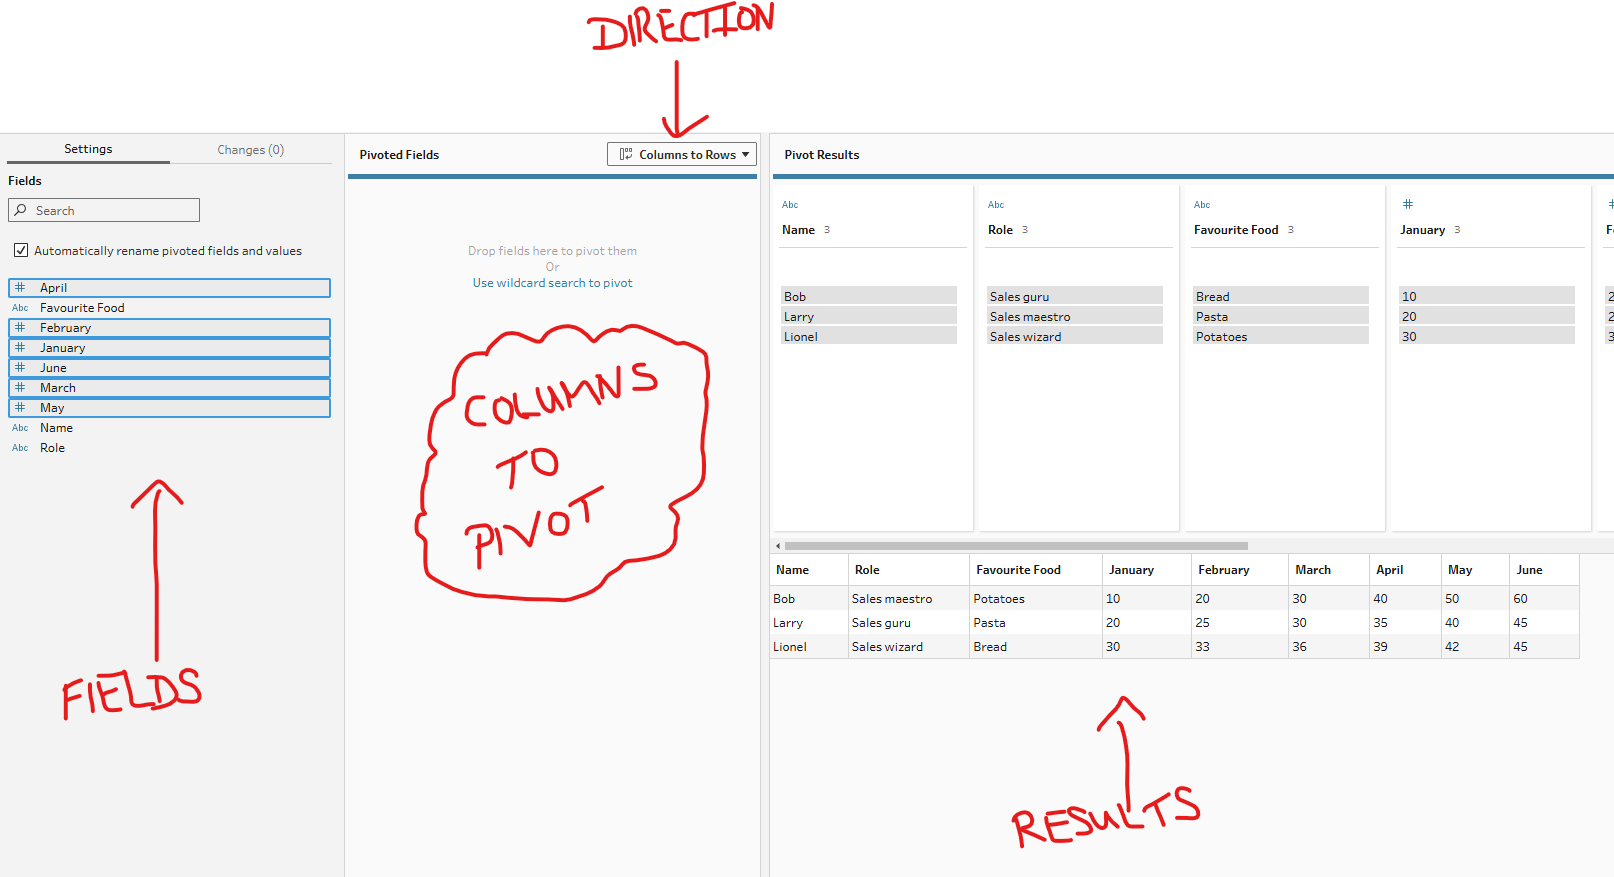
You need to ensure that your pivot direction is correct before adding the columns that you want to be changed into rows to the middle 'pivoted fields' section. You can change the names of your new fields that have been created by compiling the pivoted columns by double clicking the column header in the results profile section (the blue highlighted area in the screenshot).
Once complete, add a clean step so you can view your data.
Pivot (Rows to columns)
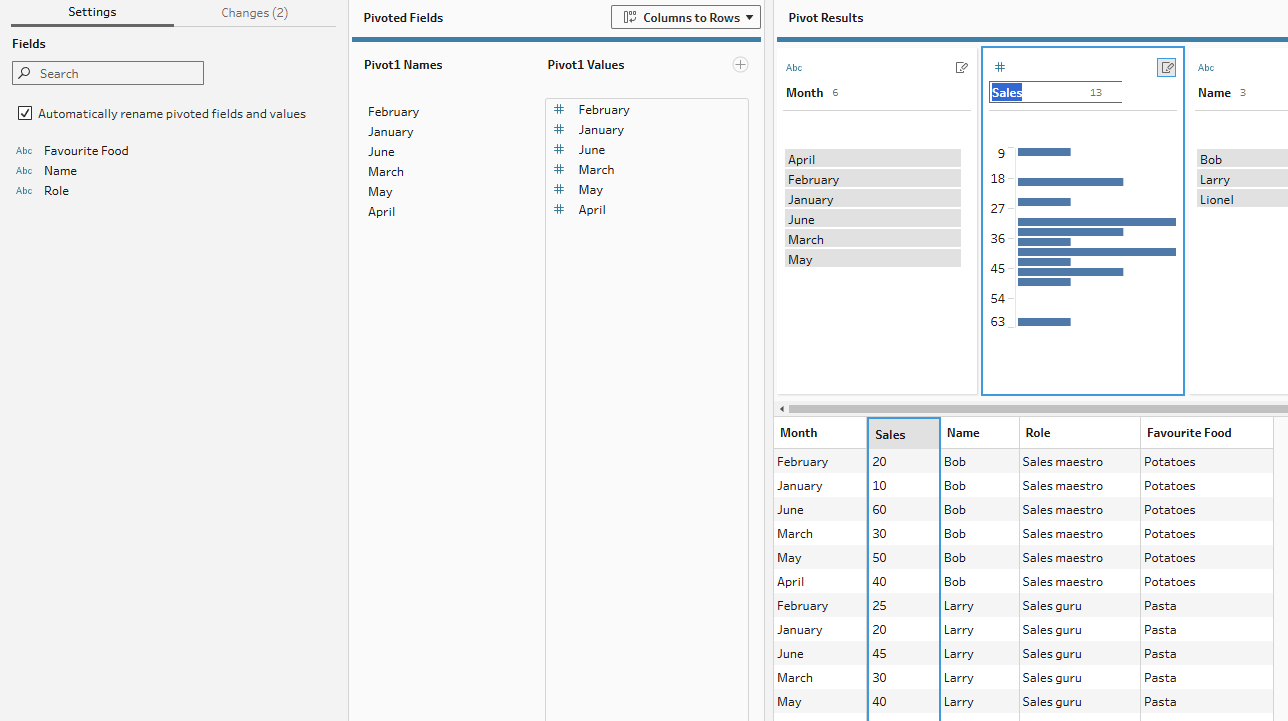
As you might have figured out, pivoting from rows to columns vs columns to rows in Tableau Prep is pretty similar. Once you add your pivot step, ensure the directionality of the pivot is correct. You should notice that when you change the directionality, a new section opens up at the bottom.
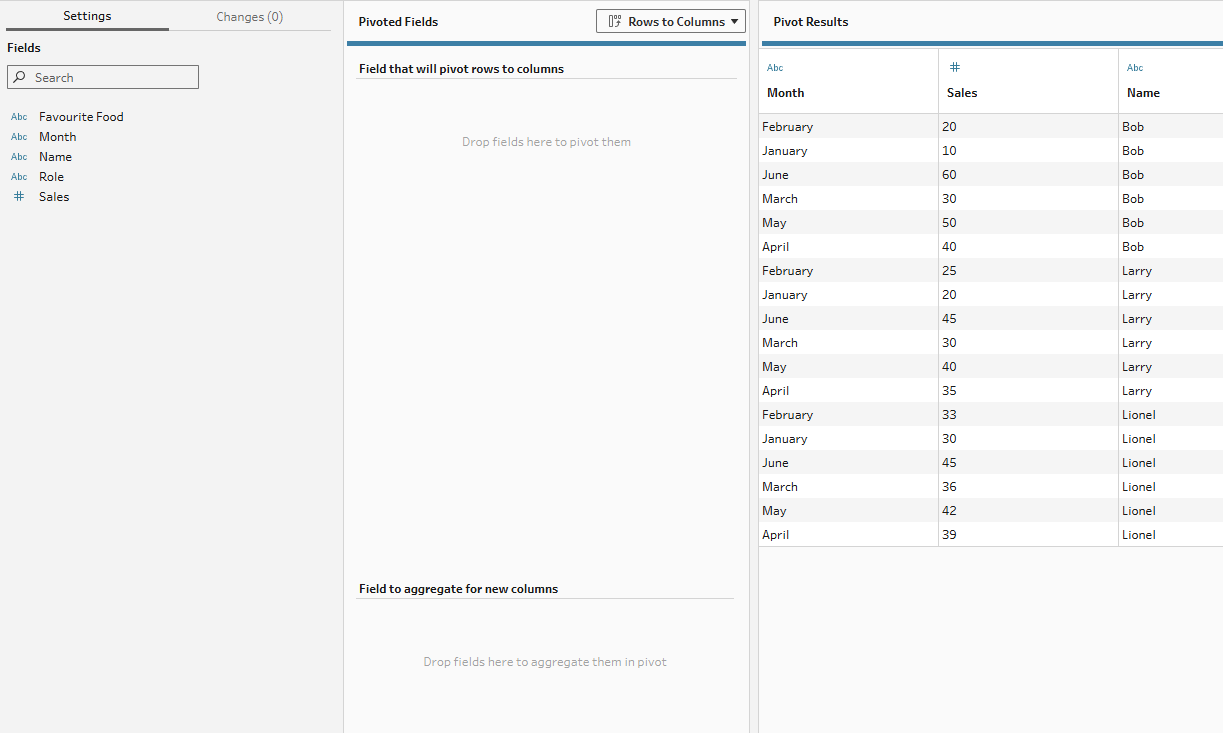
In these sections, you need to specify which rows will be made into column headers (typically your metric column) and which values will go into those columns (typically your value column). In our example here, our metric column is month because we want the rows that represent each month to become a column for each month instead. So that Tableau knows which values are associated with those new columns, we have to assign the monthly sales to the aggregate section. Our aggregation is not necessary in this case as we have a 1-to-1 match but if we had multiple values for each new column (e.g. if there were multiple Bob-January values), then the aggregation type would be important to specify. In this case, just having sum is fine.
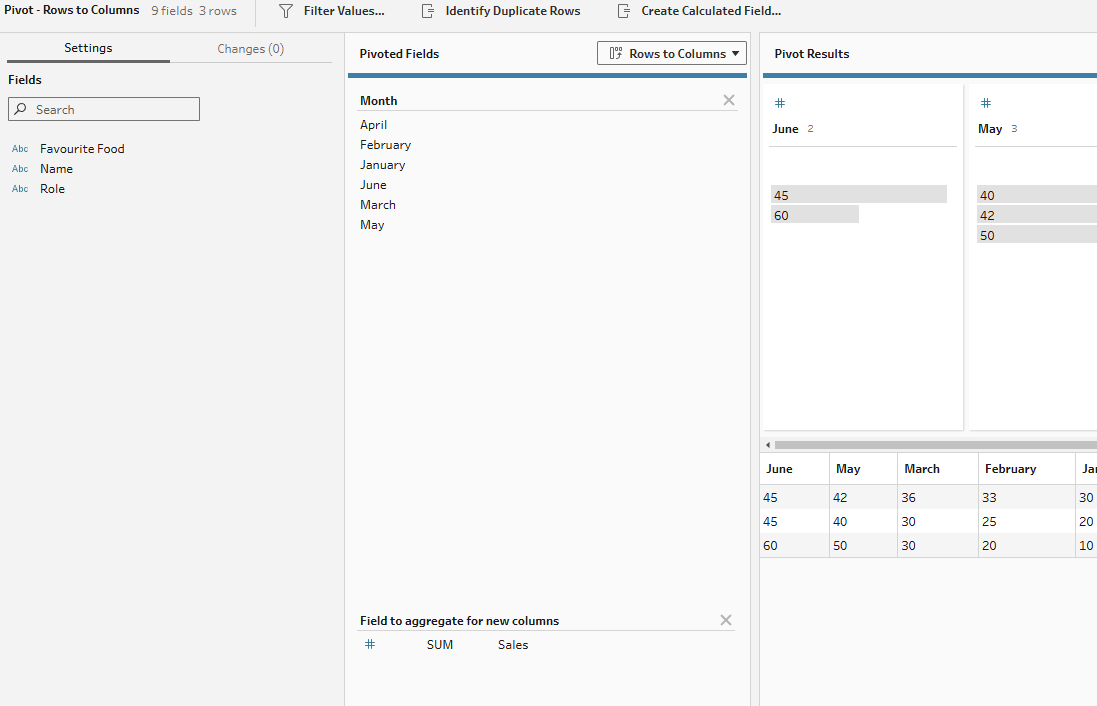
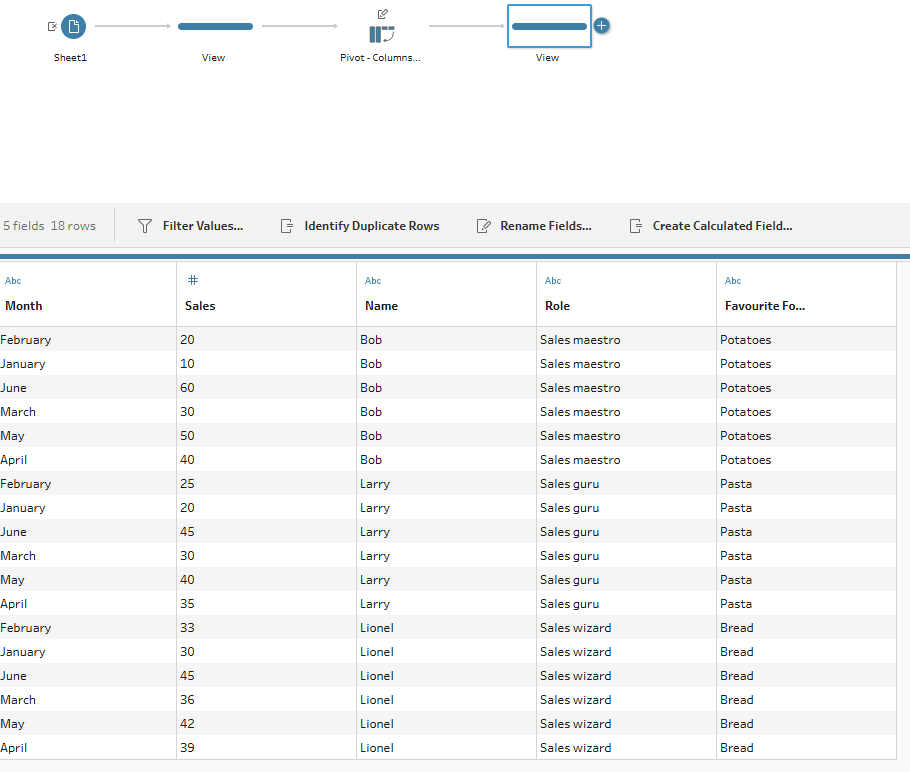
Add another clean step to view your data and we're back where we started with the original table.
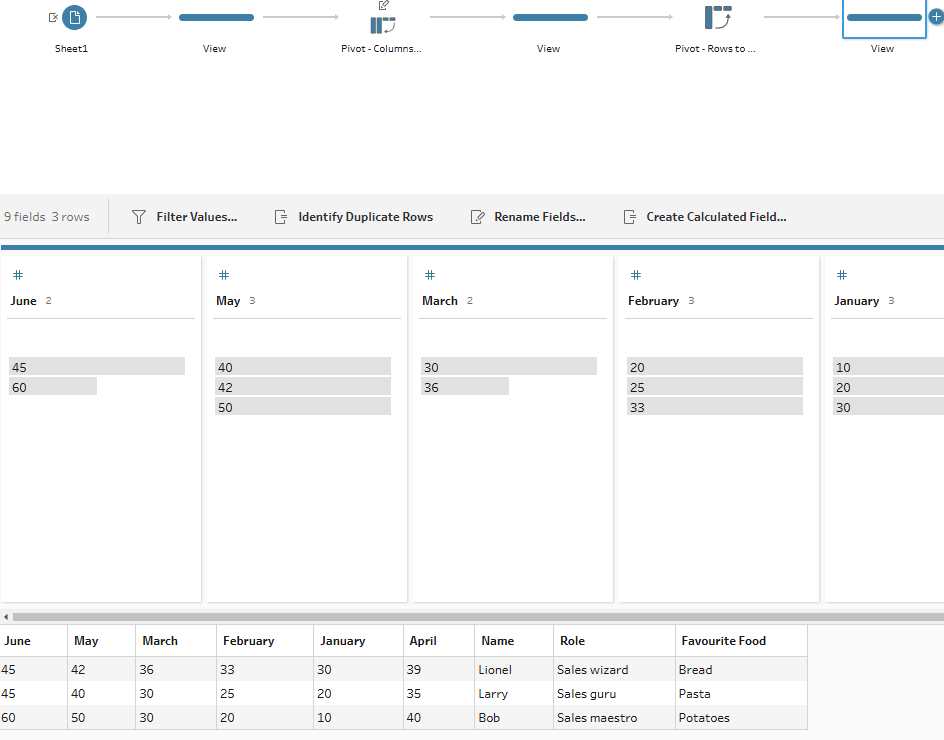
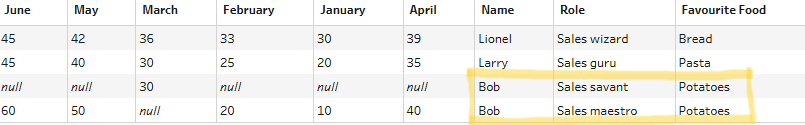
IMPORTANT TO NOTE: Whilst you can pivot from columns to rows with whichever columns that you choose, you need to be more careful with rows to columns. If you want to avoid nulls from cropping up in your newly shaped data, the only difference between the rows can be your pivoted and aggregated fields.
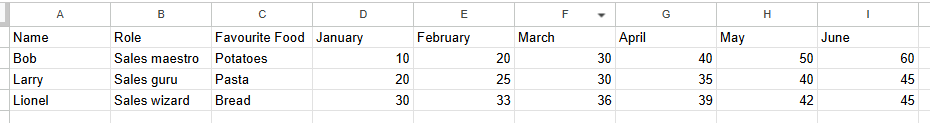
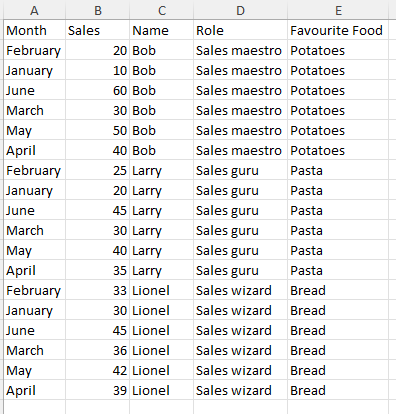
In the example below, name, role and favourite food columns are exactly the same across the different rows as you'll see (i.e. for each January to June grouping, there is a trio of name, role and favourite food columns which remain unchanged). The only thing that changes in those rows are the month and sales value. This repetitive nature is what allows for the rows to be flattened into one.
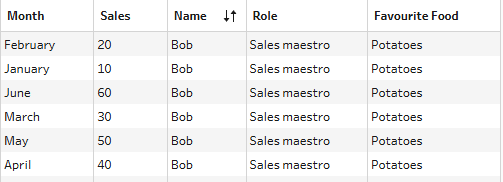
You can see what happens when the rows aren't exactly the same below.
So that's how to pivot in Tableau Prep, both from columns to rows and rows to columns. Let's explore the differences now in Alteryx.
Alteryx
Transpose
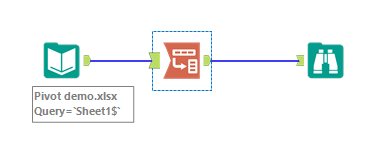
Our first change in terminology! Transpose is the Alteryx tool which you use to pivot from columns to rows. You can tell this from the handy little image used to represent the tool.

Like any Alteryx tool, after loading your data into the canvas, simply add the tool to the workflow from the transform tab.
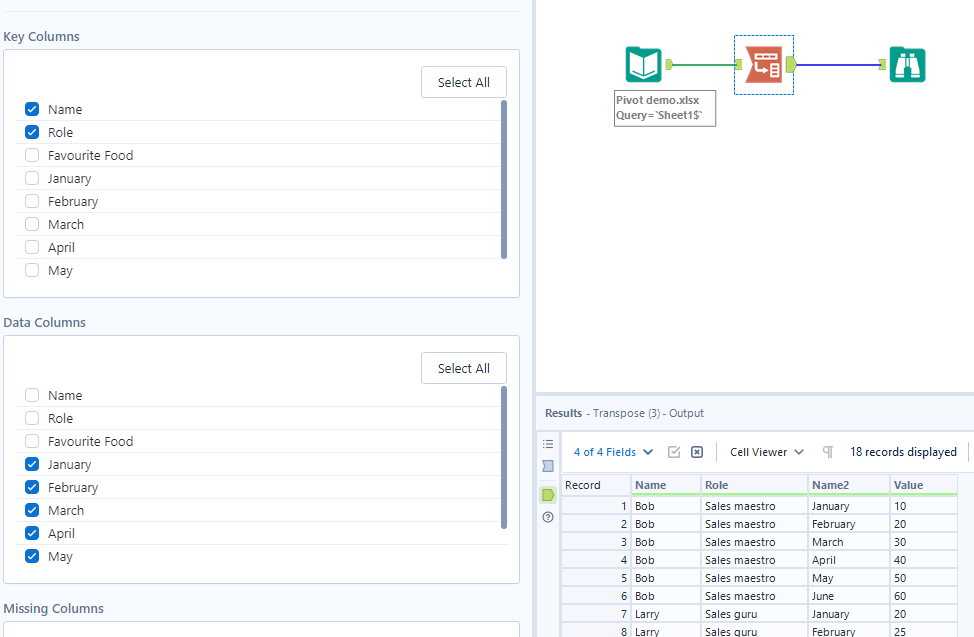
A configuration will pop-up on the left hand side where you can specify which columns you'd like to use as your repeated section and which columns you'd like to pivot. In Alteryx, these are referred to as the 'key' (I see this part like the stem) and 'data' (I see this part like the petals) columns respectively.
The default configuration of the transpose tool is having all columns selected in the data columns section. When you select a key column, it will automatically deselect in the data section as the options do not make sense to be in both sections. Be mindful when selecting and deselecting options as, unlike in Tableau Prep, not all columns have to be carried through the transpose. This is a benefit when you don't want to know the favourite food of the employee for example, but also a drawback if you accidentally lose role by deselecting from the wrong place.
Cross Tab
With your data loaded into the data pane, you know all you need to do now is add in your pivot (rows to columns) tool. In Alteryx, the equivalent tool is cross tab and this is again clearly demonstrated in the tool's image.
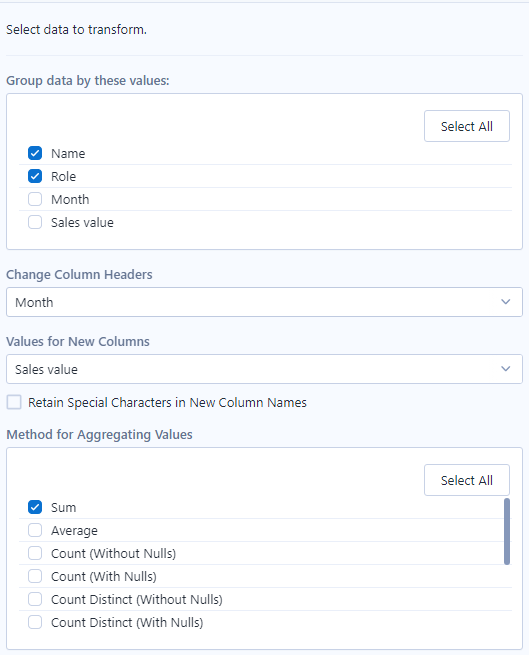
A configuration pane will pop up again. You have to specify your grouping columns (the stem), another benefit where columns can be dropped in one step unlike in Tableau Prep, and which column will become the new pivoted headers and which column will become the field values. You also have to specify the aggregation as we did in Tableau Prep.
With that, we're back to our original table! Let's see what differs in Power Query.
Power Query
Unpivot
It goes against something in my brain but unpivot is the equivalent of pivot (columns to rows) in Tableau Prep. To perform this step, we of course need our dataset loaded in before selecting the column headers which we wish to unpivot.
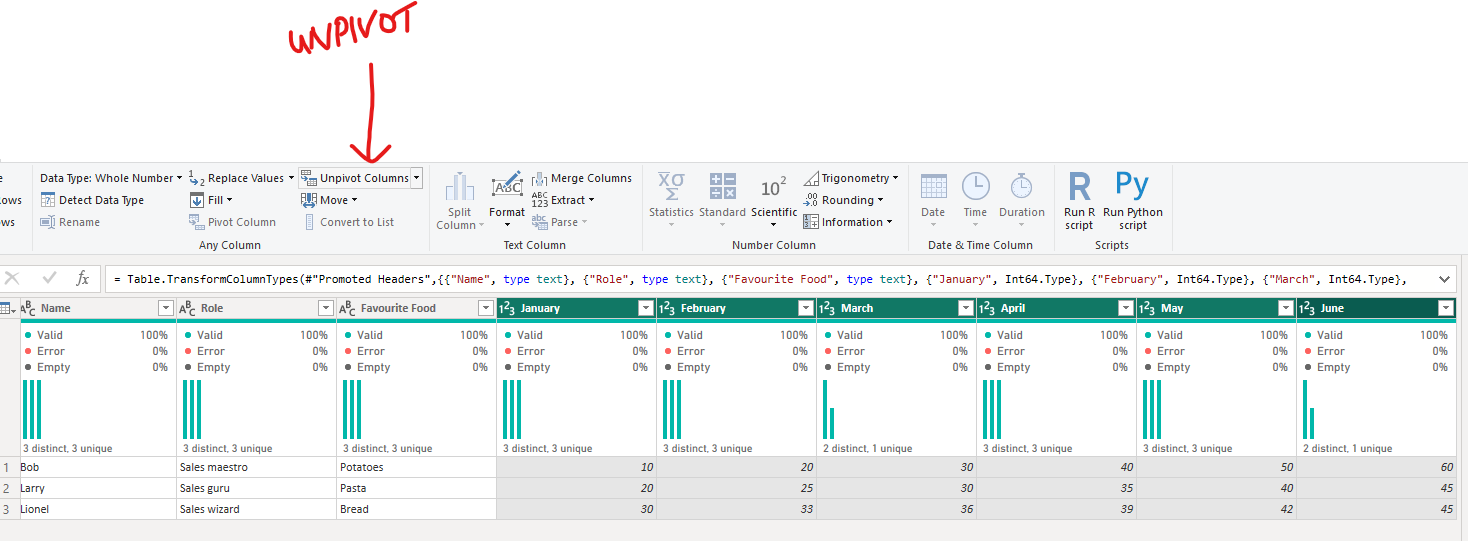
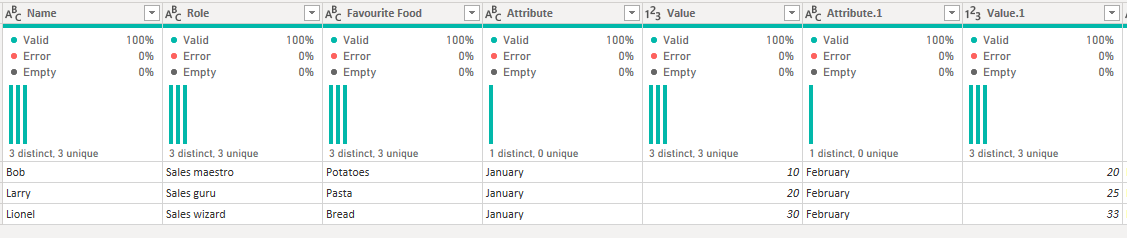
As all of our columns to unpivot are next to each other, I simply clicked on the January header, held the shift down and then clicked the June header, which automatically selected all the columns between as well. Then I went to the transform tab and selected unpivot, as above. It's important that all the columns that you want to pivot are selected in one step, otherwise you'll end up with a mess like I created as an example below, by trying to complete the steps one by one.
Alternatively if it's easier to select your 'stem' columns, like it would be in this case, you can click the carrot next to unpivot columns to get a dropdown where you can unpivot all other columns.
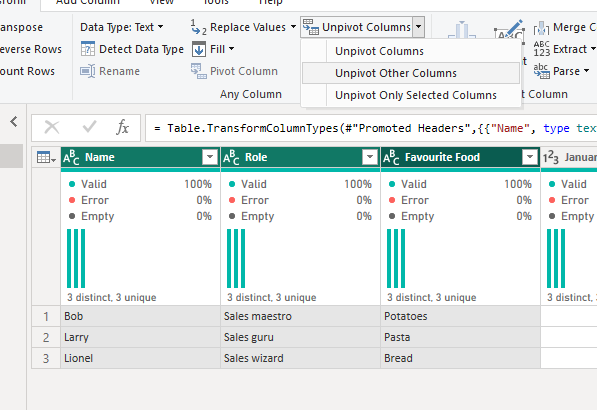
From what I can tell, and from my googling, there is no difference between unpivot columns and unpivot only selected columns, with both acting as expected from the initial unpivot example.
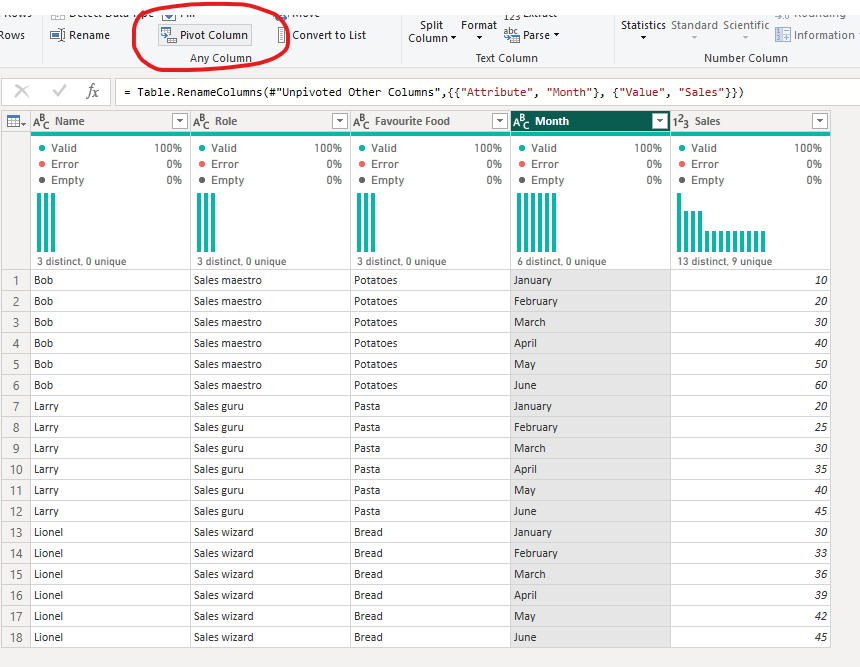
Pivot
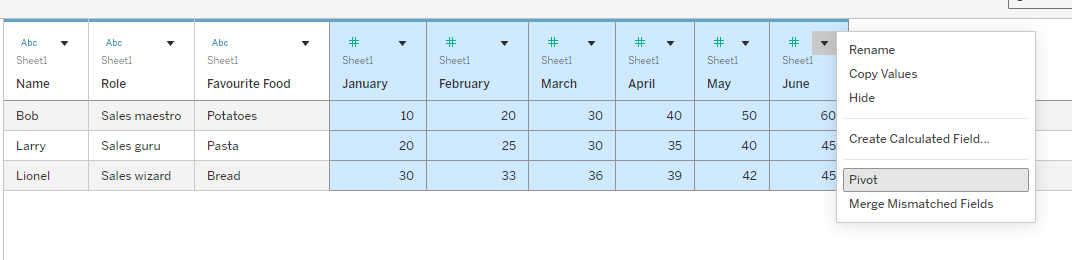
As you might have guessed, pivot is the opposite of unpivot and transforms rows into columns. It also has a slightly different set-up to that of the unpivot steps. Begin by selecting the column which you'd like to turn into your new column headers before selecting pivot in the transform tab.
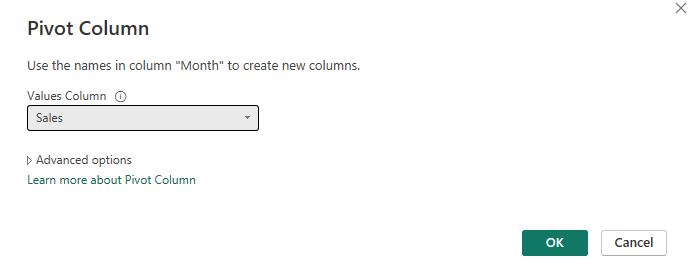
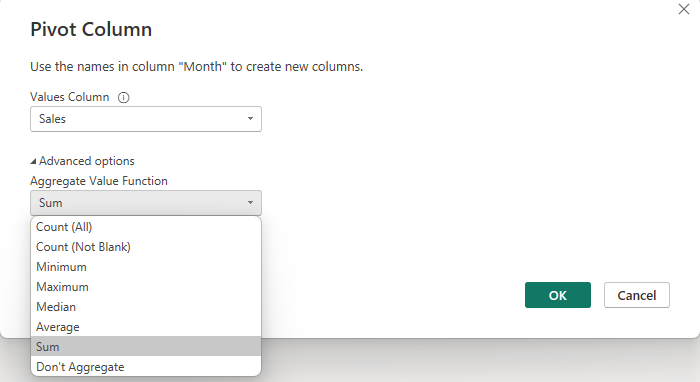
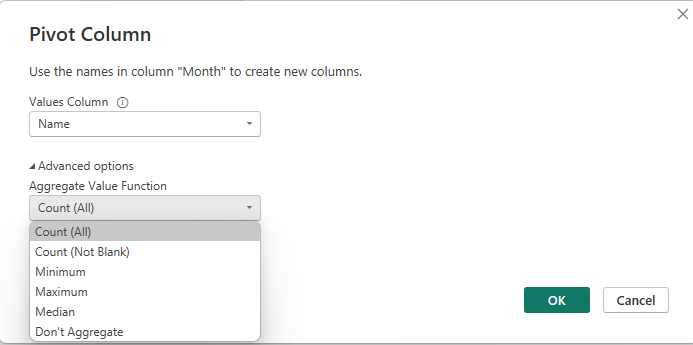
A pop-up window will appear where you have to specify which column you'd like to use as values in your new columns. The automatic aggregation is sum but if you'd like to specify a different aggregation, you can go to advanced options.
And then we're back to the beginning with our original table!
Conclusion
So now we know how to pivot, transpose, cross tab and unpivot across our different platforms. This is a crucial step for data preparation but something which I think is fairly simple to get the hang of, and hopefully something you feel confident in completing as well. When you perform these steps, remember you're reshaping your data for a purpose. The benefit of a taller table is the opportunity for aggregation whereas a wider table is beneficial for cross-metric comparison. The last tip I will leave you with is that you can actually pivot (columns to rows) in Tableau Desktop itself by selecting your columns to pivot in the data source page and right clicking pivot.
And that's everything for today. Until next time, happy pivoting!