


Welcome back to 'Back to Basics' in data preparation with me, your host! If this is your first time reading one of my 'Back to Basics' blogs, welcome. We love to see new faces. You're a few episodes behind but don't worry, you can catch up. Also don't worry because these aren't sequential at all and are simply intended to be chunks of knowledge for you to absorb in any which order you choose. I'm writing this series after completing a full year of Preppin' Data challenges (in Tableau Prep) and now feel like I've got a good grasp on some fundamental steps that frequently occur in data preparation. I wanted to share how to complete these steps with you, and as we also learn Alteryx and Power Query during training at The Data School, I've chosen to expand my repertoire and explore these steps on those platforms too. So far, I've focused on generating rows, filling down, ranking and joining. I'm hoping to do more blogs too though so head to my profile to see if I've written anything else since publishing this blog that you might also want to check out. Now that we're all on the same page, or should I say our knowledge base is topped up, let's explore today's topic.
Understanding what Top N means
You might want to return the top N (where N stands for any specified number) results in a dataset to highlight the top performers. Conversely, you might want to use the bottom N (which we also explore in this blog post despite the slightly misleading title) to highlight where categories might be underperforming. To do this, you typically need to rank so that the software knows where each performer stands, and then filter accordingly but we'll go through how to do this in each platform step-by-step in a minute.
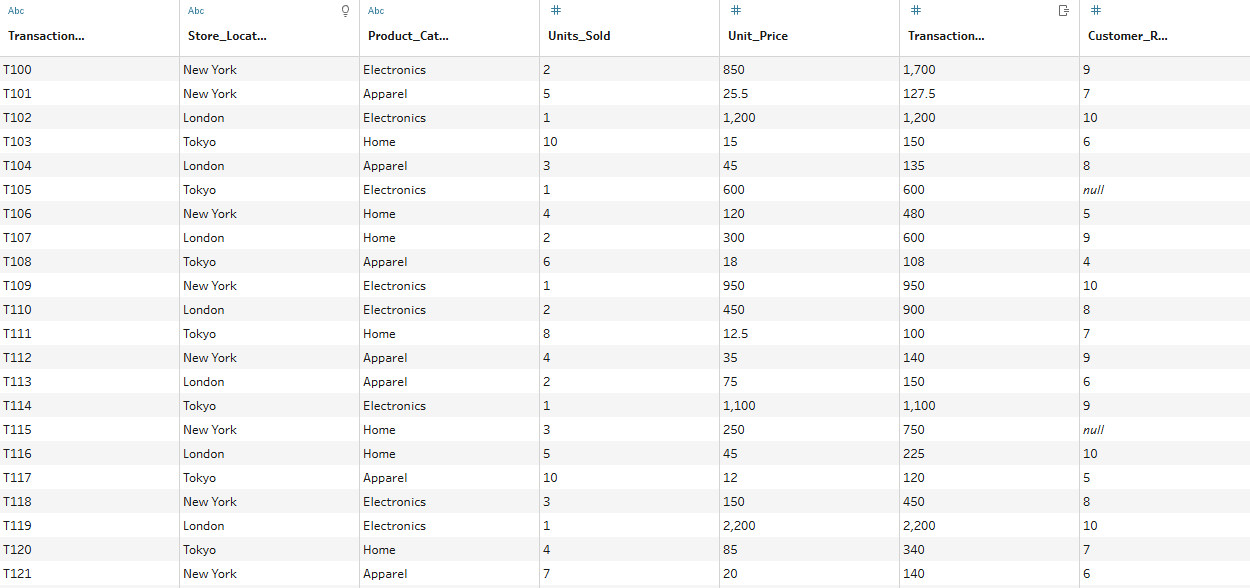
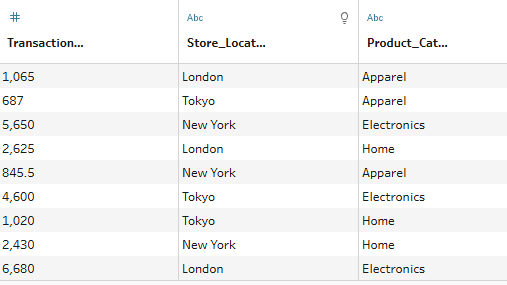
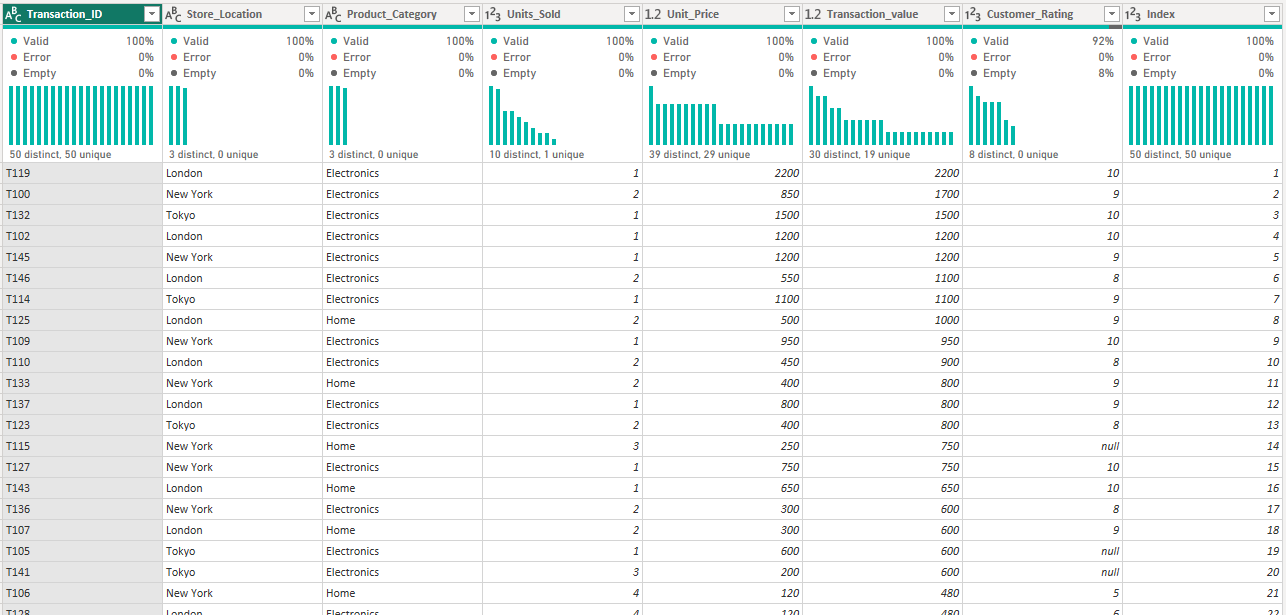
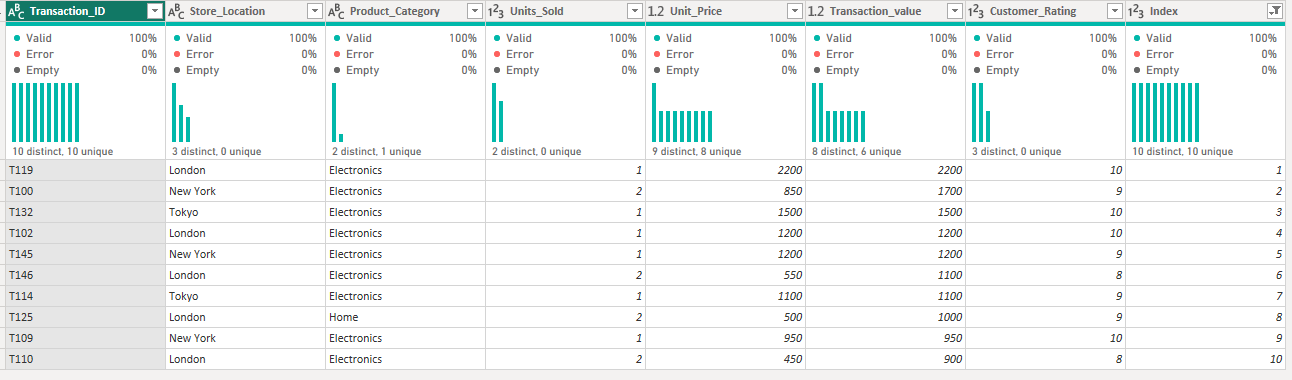
I mocked up a dataset for this blog post using Gemini to create something on a lower scale level than superstore. As you can see below, it covers transactions at 3 store locations, what category the sale comes under, how many units were sold at what price and the total transaction value as well as the customer satisfaction rating. I have plans for this dataset for another blog so stay tuned for that too.
The plan for what we will find in each of the platforms is as follows:
- Top 10 orders by transaction value
- Bottom 3 performing Location x Category combinations by total transaction values
So, let's get started!
Tableau Prep
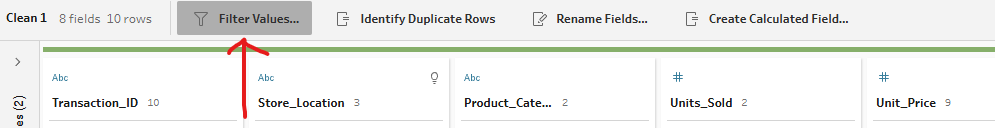
To obtain the two separate results, we'll need to split our workflows. Let's begin by going through the top 10 orders by transaction value first because we can rank this immediately. As I said before, I've covered ranking in a separate blog post so I'll breeze through that to the good bit.
Once you've got your orders all ranked, you simply need to filter for ranks less than or equal to 10.
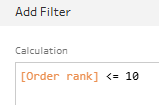
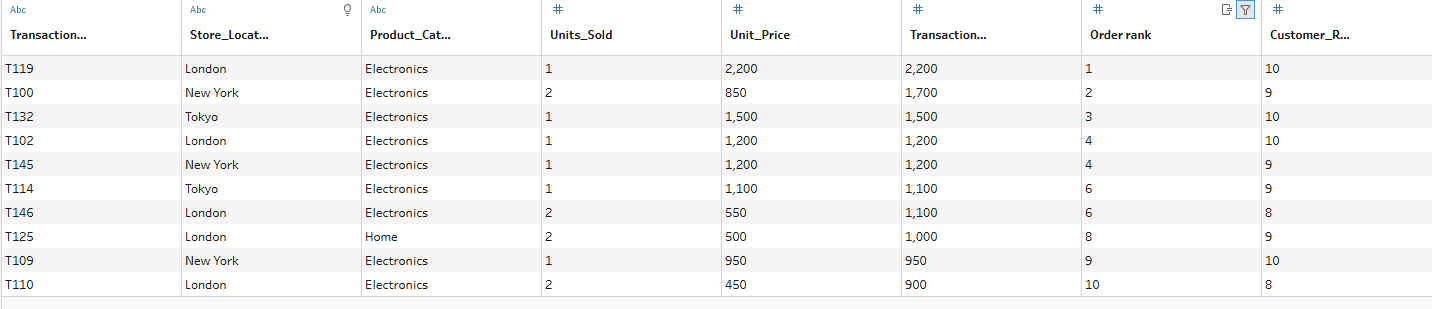
And now you have your top 10 orders by transaction value.
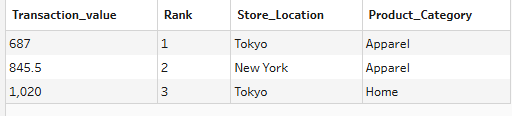
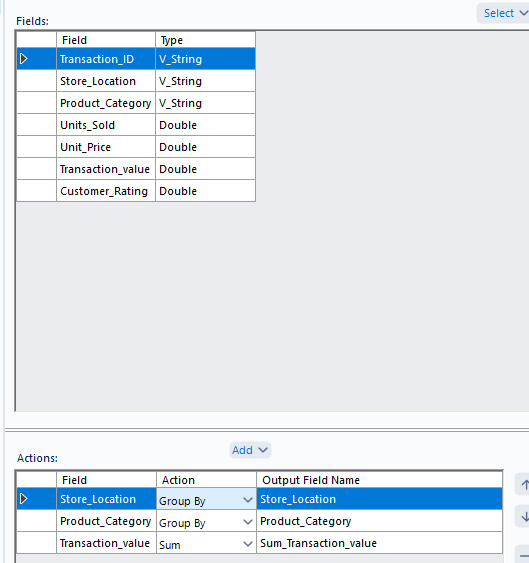
Next up: finding the bottom 3 location x category combinations. We need to aggregate first to get the total transaction value for these combinations. I'm also going to write a blog post on aggregation so head over there if you're struggling as I'm going to skip past those specifics here. Your initial output should look something like the table below.
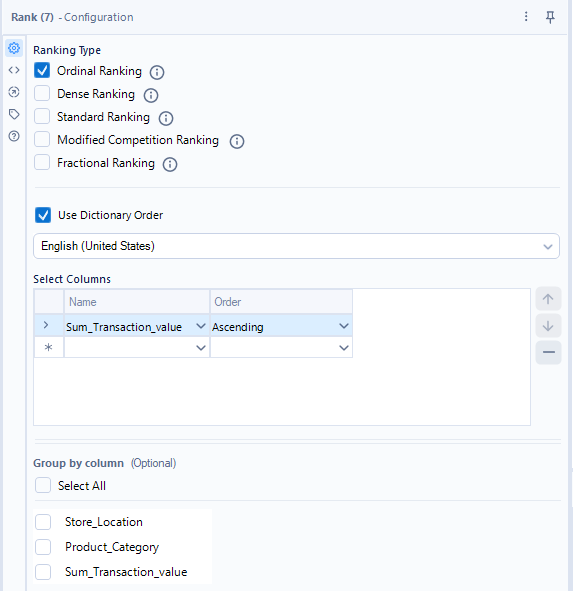
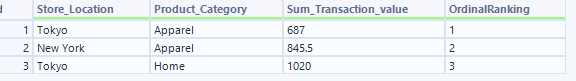
Then you need to rank these by descending value and filter again!
Alteryx
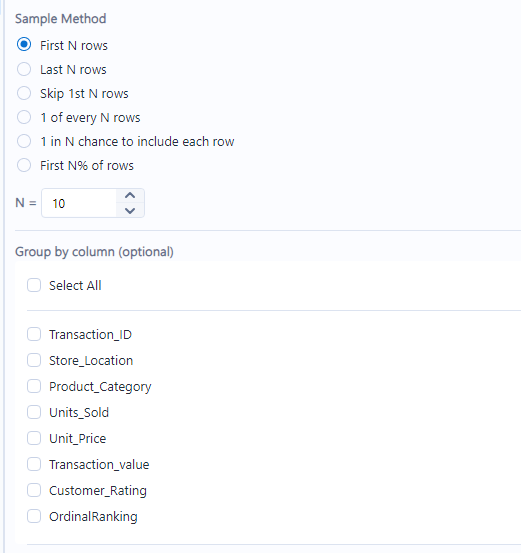
Let's begin again with our top 10 orders workflow. Start by ranking by transaction value, as I explained how to do in the other post. Then you have two options. You can either filter again like we did in Tableau Prep or you can use a tool which is unique to Alteryx: the sample tool. Drag it in from the preparation tab and set up your configuration pane like so.
Once you run it, you should have the same output as we did in Tableau Prep!
For the bottom 3 workflow, we follow a similar scenario as in Tableau Prep again. Start with your aggregation step, then rank descending transaction totals this time and add your sample tool in, setting it to 3.
Altogether not too different from Tableau Prep other than the sample tool option on offer if you so choose.
Power Query
Power Query again follows some similar steps but I think the options are a little more hidden as to how to complete them - or at least because I'm a little less familiar with Power Query/BI, I found them a little trickier to find. Once you know how to find them though, you're away!
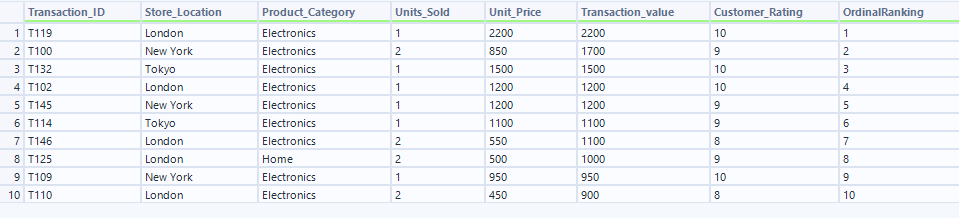
Beginning with the top 10 orders task, I sorted the transaction value by descending order and added an index column.
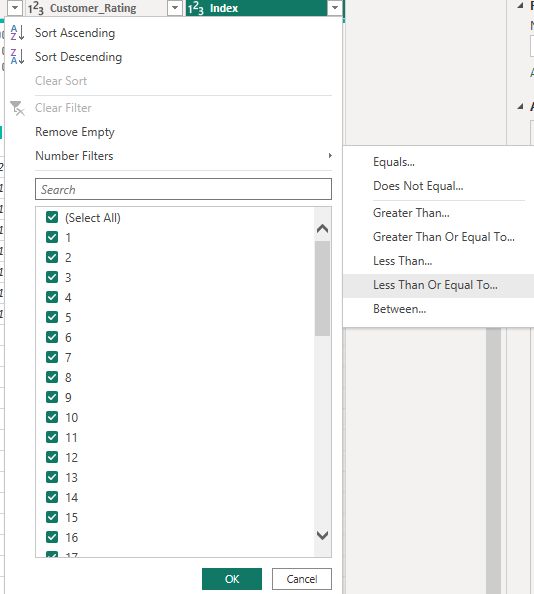
I then clicked on the arrow in the top right corner of the index column and selected number filters, specifically less than or equal to (like the formulae we'd been using in the other software).
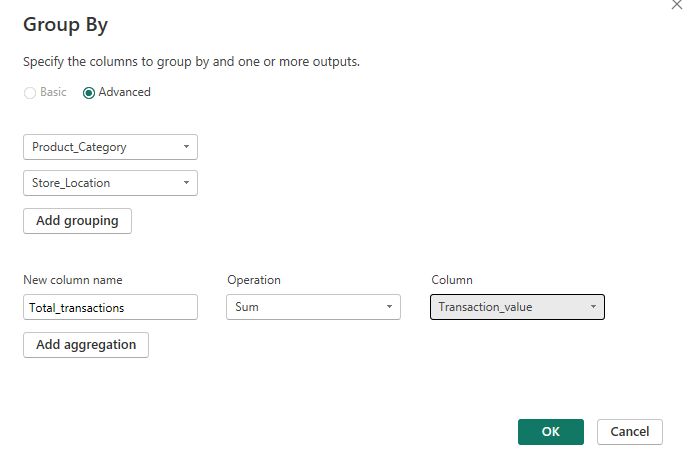
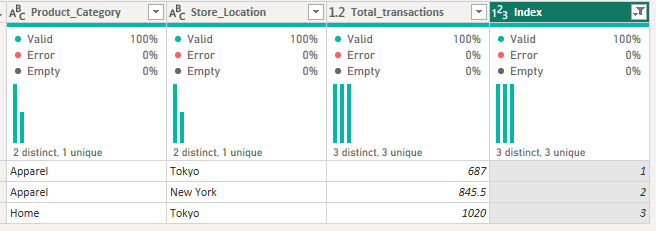
Now let's try the second task: finding our bottom 3 performing location x category combinations. We begin by aggregating our data to the correct level of detail.
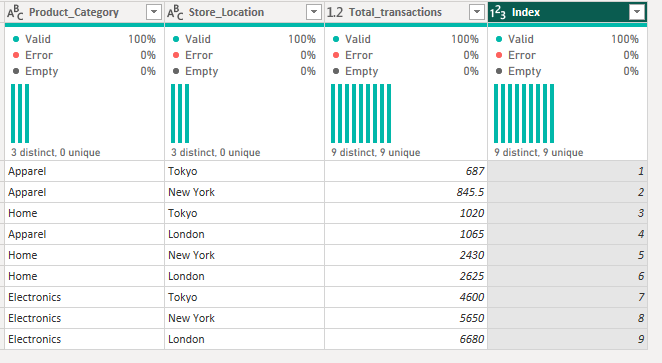
We sort ascending and add our index column. Then we filter and receive our output.
And that's quite simply how to filter to top/bottom N results during data preparation in Tableau Prep, Alteryx and Power Query. I hope this wasn't quite as daunting as it might initially have seemed. Instead, it's a combination of steps that we're capable of completing all strung together, so very easily achievable now that we know what we're doing. That's all from me for now. Until next time, happy prepping!