


For this Workout Wednesday I've chosen a challenge that incorporates everything that we have learned about Tableau at the Data School so far. It was definitely a lot harder than I initially thought but I've learned valuable techniques and took the opportunity to practice the skills that I've learned so far.
You can find the challenge using this link: https://www.workout-wednesday.com/2025w34tab/
In this blog I'll be walking you through my solution, offering some tips to avoid the rabbit holes I went down!
The challenge uses data from the sample superstore dataset. To avoid the mistake I've made download the data from the challenge description instead of using the one already in Tableau - this one lacks a column (Row ID) that you will need later on.
First, create a parameter to let the user choose a date that they would like to view the profit breakdown for. Name it Base Date - This will allow the user to choose any date they like.
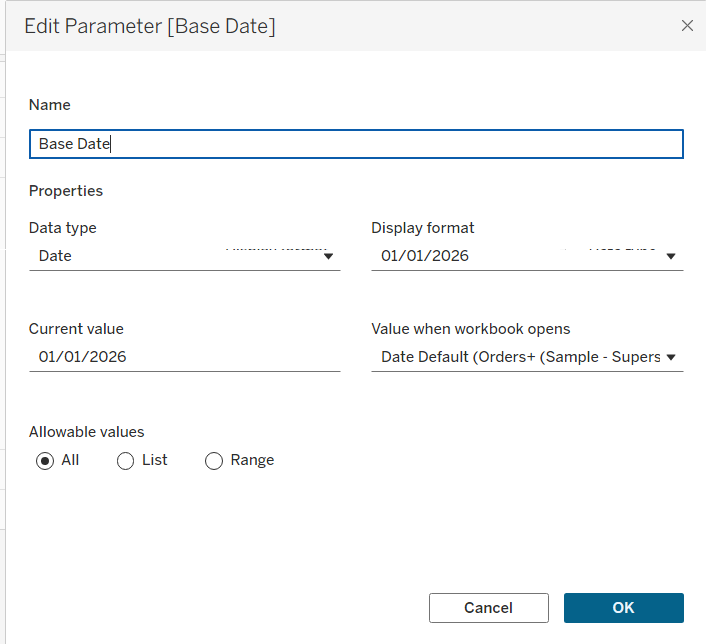
However, because the financial view is on a monthly level you'll need to create a calculated field to ensure that regardless of the date the user chooses, the view will only show the data for the previous month that the date is in. I named this Previous Month.
Previous Month Date =
//Calculate base month as a month prior to Base Date parameter
DATE(DATEADD(
'month'
,-1
,DATETRUNC('month',[Base Date])))
Tip: Before you start creating lots of calculated fields make sure they are organized into a folder that you can easily refer to.
Once you have your Previous Month field you'll need to create the fields needed for the KPIs.
Profit KPI
Profit PM =
IIF(DATETRUNC('month',[Order Date]) = [Previous Month Date],[Profit],NULL)
Profit PM LY =
IIF(DATETRUNC('month',[Order Date])= DATEADD('year',-1,[Previous Month Date]),[Profit],NULL)
Profit PM YoY =
(SUM(Profit PM) - SUM(Profit PM LY))/SUM{Profit PM LY)
Change the format of this to a % with 1 decimal place, +0.0%,-0.0%,0.0%
Sales KPI
Sales PM =
IIF(DATETRUNC('month',[Order Date]) = [Previous Month Date],[Sales],NULL)
Sales PM LY =
IIF(DATETRUNC('month',[Order Date])= DATEADD('year',-1,[Previous Month Date]),[Sales],NULL)
Sales PM YoY =
(SUM([Sales Previous Month])-SUM([Sales Previous Month LY]))/SUM([Sales Previous Month LY])
Again change the format to show the value as a percentage.
Profit Margin KPI
//Profit Margin is the ratio of Profit per Sales. The calculations above are relevant here:
Profit Margin PM =
SUM(Profit PM)/SUM(Sales PM)
Profit Margin LY =
SUM(Profit PM LY)/SUM(Sales PM LY)
Profit Margin YoY =
Profit Margin PM - Profit Margin LY
Tip: Did you know that you can build all 3 KPIs in one worksheet by typing MIN(0) in your columns x3?
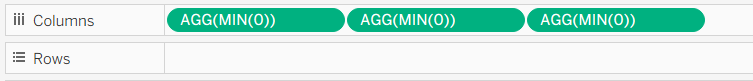
This will allow you to have essentially 3 axes for your 3 KPIs. In each marks card MIN(0) (1),MIN(0) (2) and MIN(0) (3) you need to drag the 'Value' PM and 'Value' YoY to text marks for each of the KPIs.
You can also create an alert color if the YoY difference is negative by creating a calculated field for each KPI value like below:
//Highlight KPI when YoY is negative
[Profit Previous Month YoY] < 0
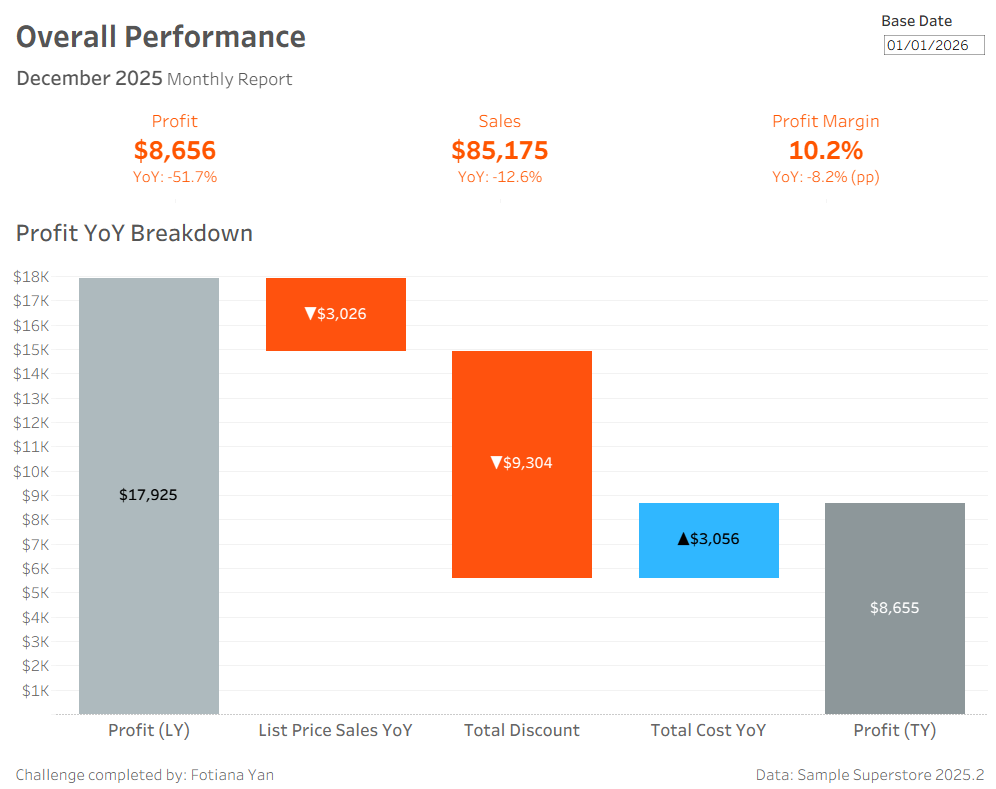
Next, let's build the waterfall chart!
Before you start building you will also need to create a few more calculations like List Price, Discount Amount and Cost for both the current year and the previous year along with a YoY % difference.
List Price =
[Sales]/(1-[Discount])
List Price PM =
IIF(DATETRUNC('month',[Order Date]) = [Previous Month Date],[List Price],NULL)
List Price PM LY =
IIF(DATETRUNC('month',[Order Date]) = DATEADD('year',-1,[Previous Month Date]),[List Price],NULL)
List Price PM YoY =
SUM([List Price PM])-SUM([List Price PM LY ])
Discount Amount =
[List Price]*[Discount]
Discount Amount PM =
IIF(DATETRUNC('month',[Order Date]) = [Previous Month Date],[Discount Amount],NULL)
Discount Amount PM LY =
IIF(DATETRUNC('month',[Order Date]) = DATEADD('year',-1,[Previous Month Date]),[Discount Amount],NULL)
Discount Amount YoY =
SUM([Discount Amount PM])-SUM([Discount Amount LY])
Cost =
[Sales]-[Profit]
Cost PM =
IIF(DATETRUNC('month',[Order Date]) = [Previous Month Date],[Cost],NULL)
Cost PM LY =
IIF(DATETRUNC('month',[Order Date])= DATEADD('year',-1,[Previous Month Date]),[Cost],NULL)
Cost PM YoY =
SUM([Cost Previous Month])-SUM([Cost Previous Month LY])
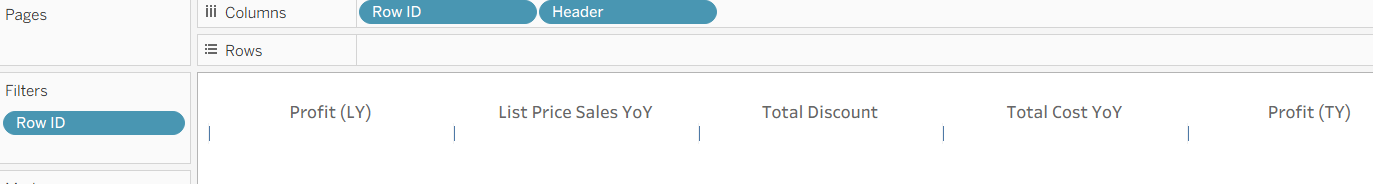
After creating those calculations you want to use [Row ID] on your columns to create 5 headers, we are only going to use rows 1-5 by filtering to show up until Row ID 5. The calculation for the header of each bar in the waterfall chart is:
Headers =
CASE [Row ID]
WHEN 1 THEN "Profit (LY)"
WHEN 2 THEN "List Price Sales YoY"
WHEN 3 THEN "Total Discount"
WHEN 4 THEN "Total Cost YoY"
WHEN 5 THEN "Profit (TY)"
END
Drag [Row ID] and the [Headers] fields onto your columns and you should be able to see 5 distinct headers which will be used for each bar of our waterfall chart.
Next, you need to create the values for the headers:
Values =
CASE [Row ID]
WHEN 1 THEN {FIXED : SUM([Profit PM LY])}
WHEN 2 THEN {FIXED : SUM([Profit PM LY])} + {FIXED : ([List Price PM YoY])}
WHEN 3 THEN {FIXED : SUM([Profit PM LY])} + {FIXED : ([List Price PM YoY])} + (-1*{FIXED : ([Discount PM YoY])})
WHEN 4 THEN {FIXED : SUM([Profit PM LY])} + {FIXED : ([List Price PM YoY])} + (-1*{FIXED : (Discount PM YoY)}) - {FIXED :(Cost PM YoY)}
WHEN 5 THEN {FIXED : SUM([Profit PM])}
END
Note that for List Price, Discount and Cost the values are already aggregated so they would break the calculation if they were wrapped inside a SUM.
Drag the [Values] calculation onto rows and change the marks type to Gantt Bar. These determine the ceiling of each bar, but we also want to create the length of the bars:
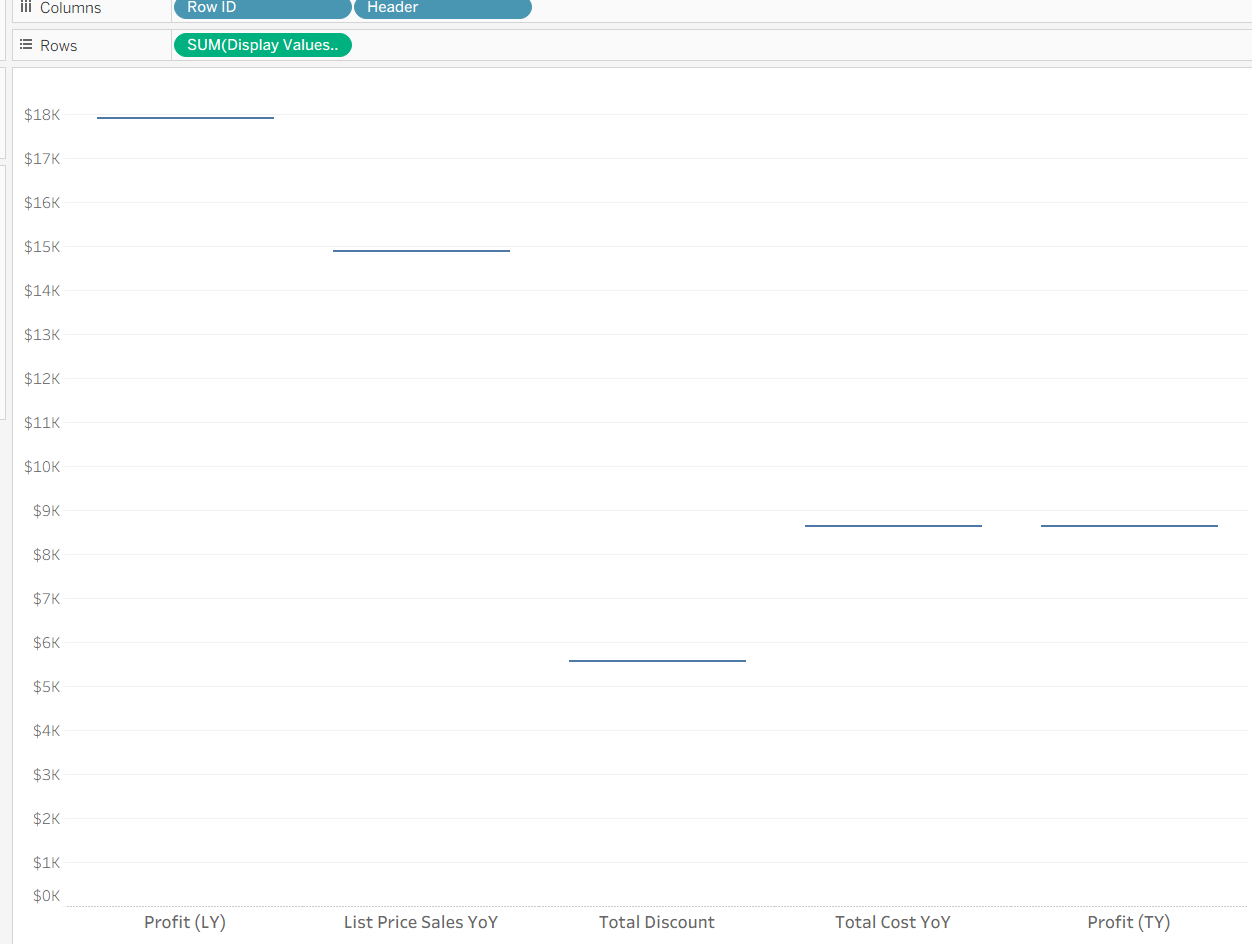
Size =
(CASE [Row ID]
WHEN 1 THEN { FIXED :SUM([Profit Previous Month LY ]) }
WHEN 2 THEN {FIXED :[List Price Previous Month YoY]}
WHEN 3 THEN (-1*{FIXED: [Discount Previous Month YoY]})
WHEN 4 THEN -1*{ FIXED :[Cost Previous Month YoY] }
WHEN 5 THEN {FIXED :SUM([Profit Previous Month ])}
END)-1
Then drag [Size] onto marks size and click onto the green pill so you can change it from [SUM([Size]])] to [SUM(-[Size]])]. This will change the direction of the length, instead of them being extended upwards from your Gantt Bar these will be extended downwards.
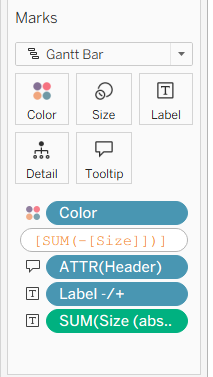
Next to color the bars depending on whether it was a negative or positive, the following calculation needs to be created.
Color =
CASE [Row ID]
WHEN 1 THEN "Profit LY"
WHEN 5 THEN "Profit TY"
ELSE
IF -[Size] < 0
THEN "Positive"
ELSE "Negative"
END
END
Drag [Color] to the color marks. You can also add text labels to the bars, displaying the value and whether it's a negative or positive by creating the below fields:
Labels:
Label -/+ =
IF [Color]="Profit TY" OR [Color]="Profit LY" THEN ""
ELSEIF [Color]="Negative" THEN "▼"
ELSE "▲"
END
Value =
ABS(-[Size])
Drag these to the text marks and format it as appropriate within the text pop up window.
Final step, combine the KPIs with the waterfall chart in the report dashboard. I hope you enjoyed this challenge as much as I did, and learned a few new things! Personally, I find the Workout Wednesdays a perfect opportunity to learn new techniques and best practices so more of this content will follow!