


If you are a "Friends" fan like me, you should play the song while you read this post!
Today we will see how to pivot your data using Alteryx
Pivoting tables is a powerful tool for data analysis and can help answer important questions about the data. Essentially, pivoting tables refers to changing the layout of your tables. Converting columns into rows and rows into columns - to be more exact. In Alteryx, you may need to pivot as some tools require a specific data structure.
There are two distinct tools for pivoting in Alteryx. They are called the Transpose and the Cross Tab tool. As a general rule, you should have a clear idea of how your tables should look before diving into tool configurations.
- Transpose Tool
The Transpose tool pivots the orientation of the data in a table by moving the horizontal data to a vertical axis.
Key columns: This section specifies which key columns in the dataset will not be changed. However, it will be duplicated in the new rows created by the tool.
Data Columns: The columns that are selected in this section will have their names and values separated and stacked on two different columns named "Name" and "Value".
NOTE: Columns that are not selected in Key or Data columns will be dropped.
Missing Columns: Refers to how the tool should react when any of the specified key and data columns are missing from the input.
This configuration will have the "Item ID", "Region", "Sales Office" and "Year" columns unchanged but replicated vertically each time the month columns are repeated. These are converted to a vertical format as well as their values.
Below is a sample of the data before and after the transpose tool with the configuration above:
- The Cross Tab
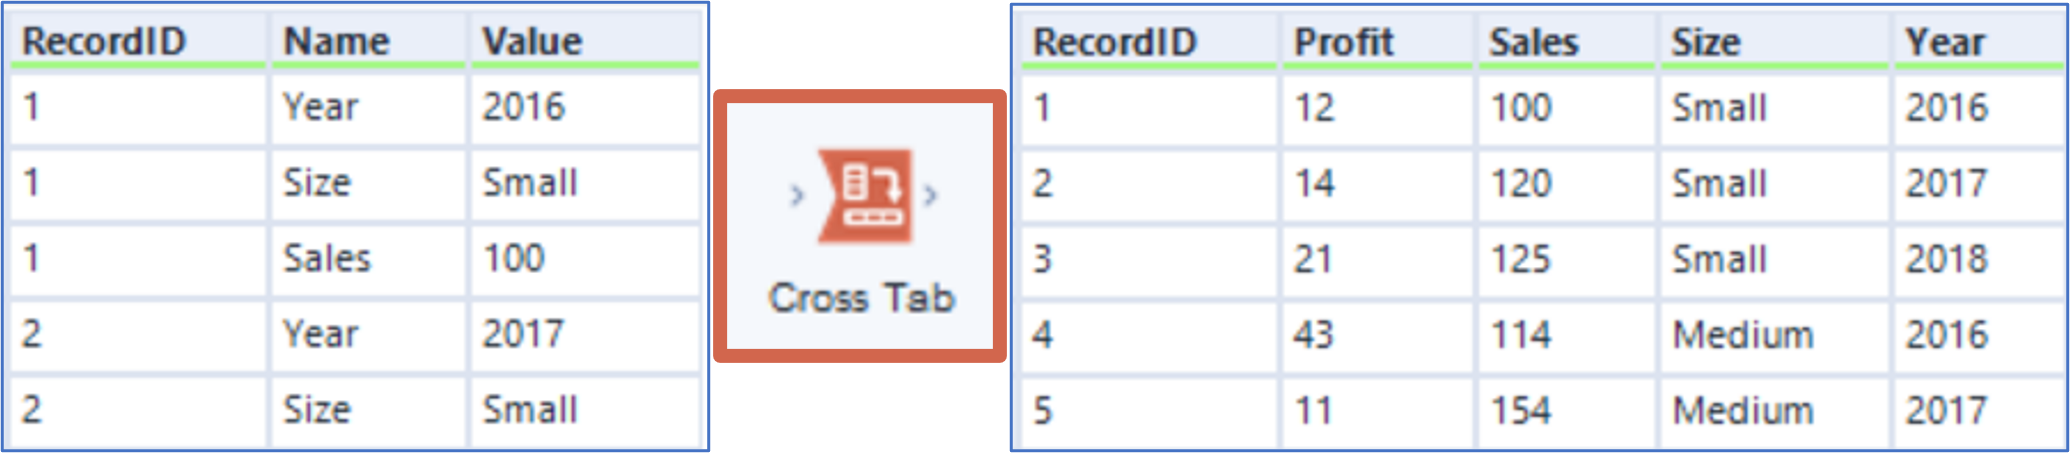
The Cross Tab tool is indeed the opposite of the transpose tool. This tool pivots the data from a vertical layout to a horizontal one and performs summarisation.
This tool configuration is a little more complex than the transpose tool. It has 6 sections: Group Data by these Values, Change Column Headers, Values for New Columns, Method for Aggregating Values, Separator and Field Size.
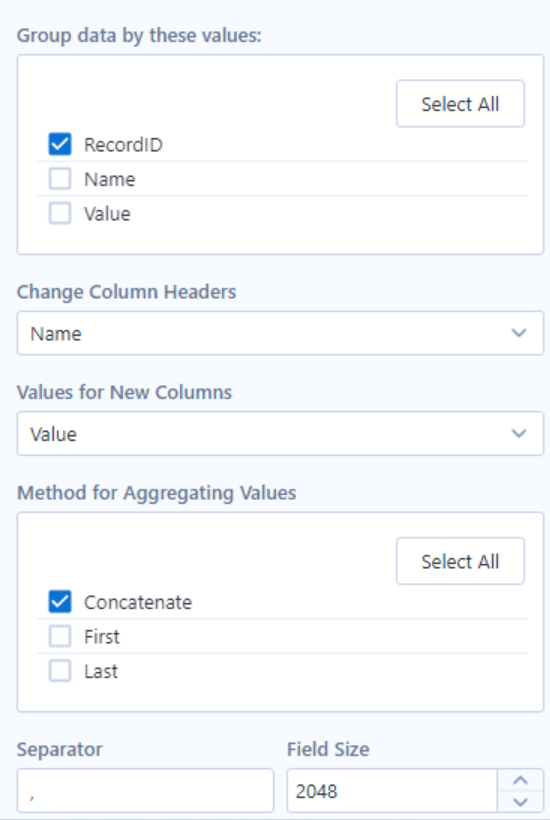
Group data by these values: Groups the selected columns for which there is one unique value per row.
Change Column Headers: The new columns that are created will be populated with the unique values in the rows of the selected column.
Values for New Columns: The selected columns values will populate the column(s) created from the header column.
Method of Aggregating Values: At least one of three methods needs to be selected for the transformation to take place. The aggregation methods change depending on the data type of the incoming column.
Separator and Field Size: Characters entered in the separator section will be added between the concatenated strings. The field size refers to the maximum field length.
Below is a sample of the first five rows before and after the Cross Tab tool with the configuration above:
Now it's your turn. Try to pivot your data and if you have any question, just drop me a message!
- For more tips, you can follow me on LinkedIn.
- You can check out my portfolio on my Tableau Public.
- This song is so nostalgic - I can't even click on skip intro on Netflix. For me Friends (1994) it's the best TV series ever. Watch the all 10 seasons - You won't regret it!