


If you’ve ever tried to use Tableau Server without a mouse, you’ll have realised how much of a mess it is. Pressing ‘tab’ to move through a dashboard just bounces you around random graphs and filters with no regard for any logical order. This is because before 2021.3, Tableau set this ‘focus order’ to the order that objects were added to the dashboard. They saw the error in their ways last year, but alas all dashboards made before that remain a mess for any keyboard-only users.
I recently worked on an Alteryx app to automatically update the focus order of old dashboards on Tableau Server. It takes a list of workbooks as an input, then automatically downloads them from Server, updates the focus order and re-uploads them, overwriting the original. This is the first in a little series of blogs about this project, this one focusing on how the focus order in Tableau is set and how to change it.
First of all, lets have a look at a Tableau workbook:
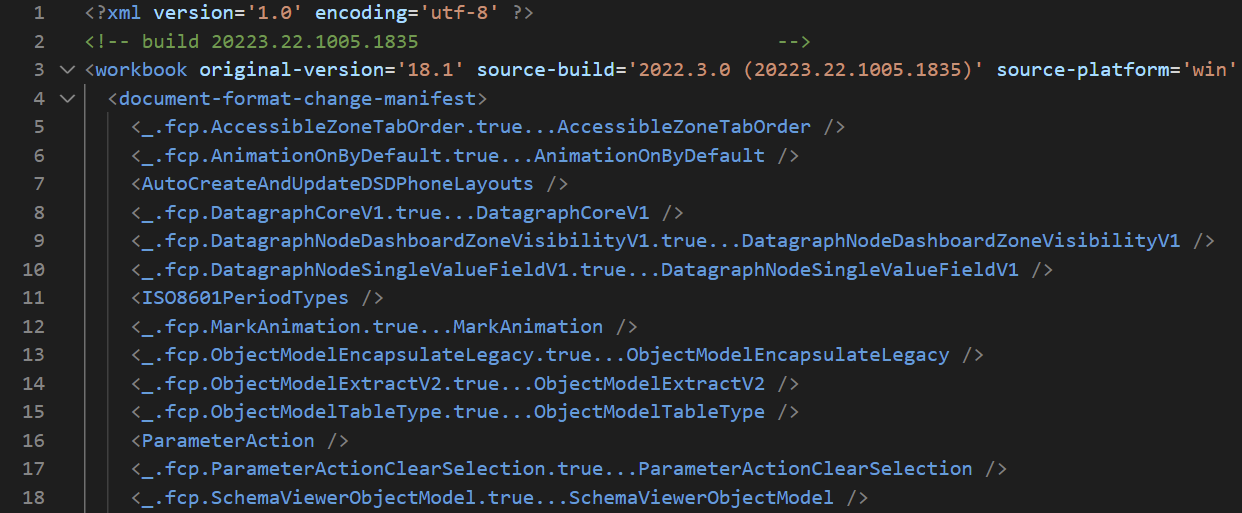
This probably isn't how you're used to seeing Tableau workbooks, but all they are under the hood are some lines of XML. In here we can find what determines the focus order and change it. Lets have a look at where the focus order is set:

Here is an example of a line of XML denoting a "zone" - i.e. an item on a dashboard or worksheet. The focus order is determined by the "id" field, here set to 80. Before update 2021.3, the "id" field was simply determined by when the item was added to the dashboard: if it was the first item added the "id" would be 1, and so on. This clearly does not help keyboard-only users to navigate in any logical way. In 2021.3 Tableau changed this - "id" was now set to a top-to-bottom, left-to-right order. Sadly this did not apply to old dashboards, so our only way of changing them is to change this field within the XML.
Luckily these "zone" rows in the XML give us an easy way of doing that - the "x" and "y" fields that determine the position of the item on the dashboard. By sorting the zones by "y" and "x", we can change the "id" values to run top-to-bottom, left-to-right. Lets have a look at how we can automate this in Alteryx.
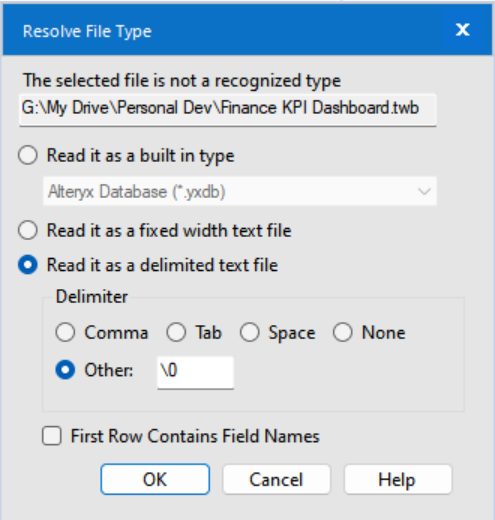
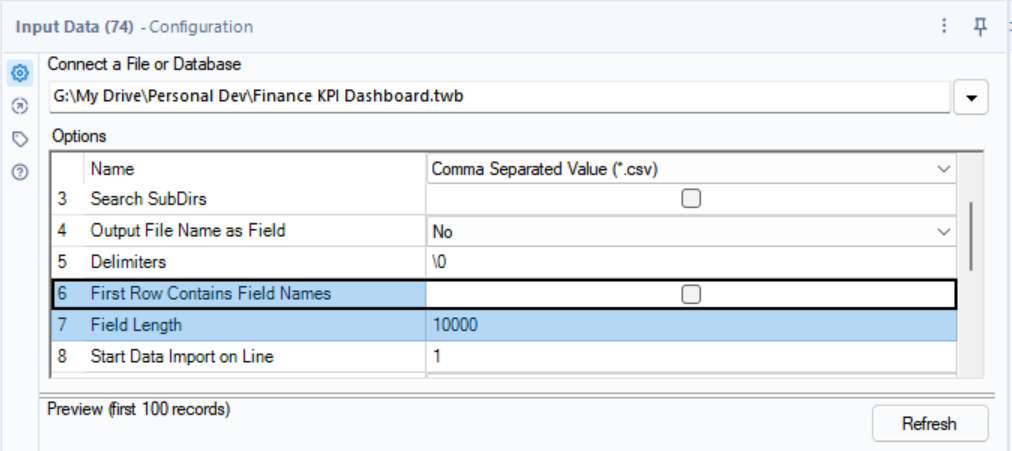
First we need to import our Tableau dashboard XML into Alteryx. We can do this by reading it in as a delimited text file, with the delimiter "\0" (empty):
As there can be very long rows within the XML, make sure to increase the field length in the input tool. Also make sure you're not importing the first row as a header:
Now it's imported into Alteryx, let's isolate our dashboards. We need to change the focus order of each one individually so we get the proper order for each one. Each chunk of dashboard XML starts with a line stating the dashboards name, and ends with a line of "</dashboards>", so I used this logic to give every dashboard on the workbook a specific number with a multi-row formula tool. I made the rest of my workflow into a batch macro to process one dashboard at a time.
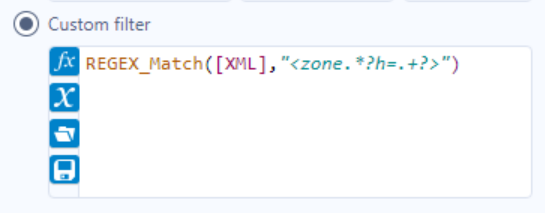
We can then isolate the rows with zoning information: I used this filter configuration:
With some simple data prep we can turn these XML rows into a proper table with all of the information we need:
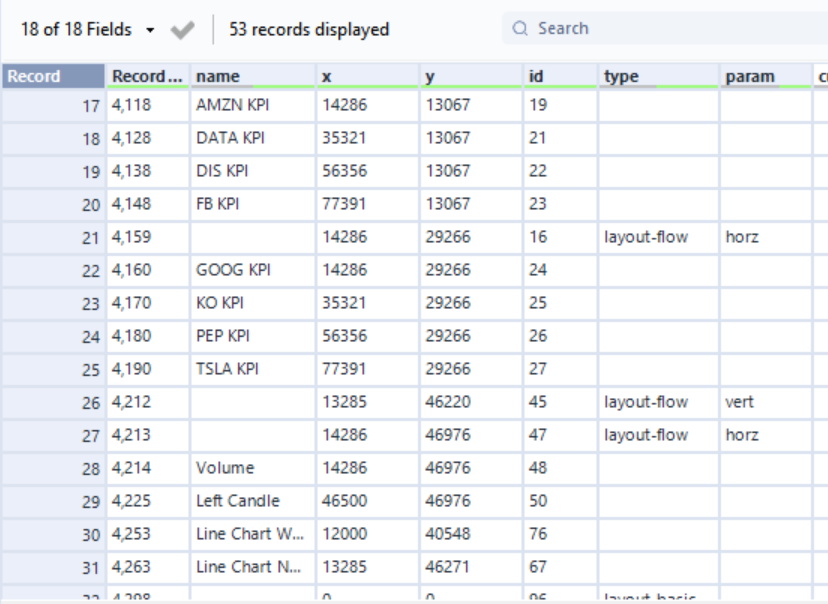
This table contains all of our dashboard items, including containers. However, there are some items we don't necessarily want to adjust - as we can't tab to them in a dashboard. I chose to filter them out before adjusting, but I'm wondering now if you could adjust the "id" of all of these rows without any filtering...
Anyway to filter them out I used this logic:
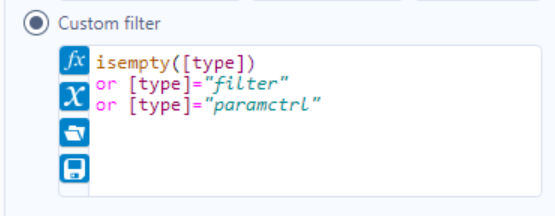
Which I found to work for multiple dashboards but I'm still not sure if this is foolproof.
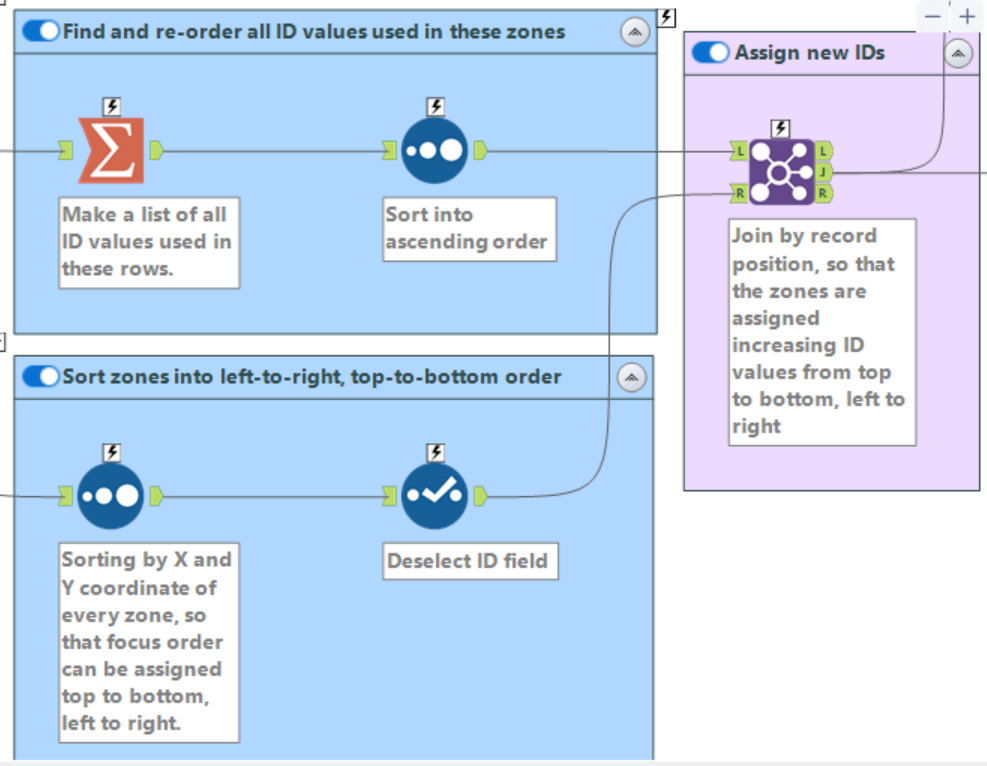
To set the focus order I then sorted the zones using "y":asc and "x":asc - to give a top-to-bottom, left-to-right sort. I then took all of the "id" numbers used in these zones, re-ordered these from smallest to largest, and re-assigned them to the zones:
There is one small hitch in this method - zones with duplicate "id" fields. For a reason that I don't know, there are often multiple zones with the same "id" values, but with different co-ordinates. I added a few tools to my workflow to ensure these were set to the same focus order as their duplicates. After I realised that these duplicates always came after their 'real ' zones in the XML, and therefore had a higher record ID, I used this logic to remove them...
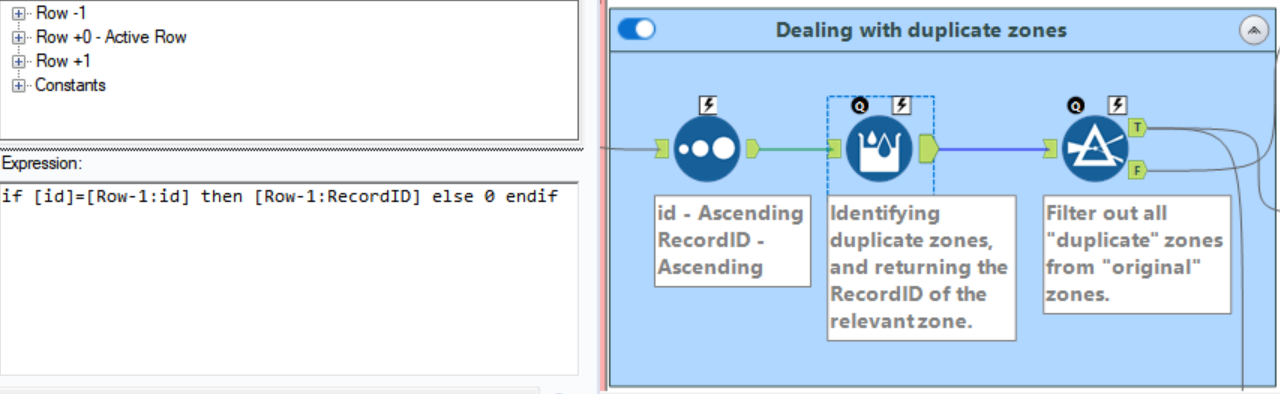
...and then added them back in, before changing their "id" to that of their 'real' counterparts.
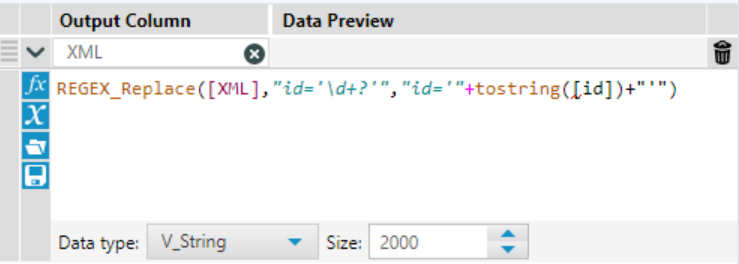
Now onto the output. I thought about reforming the table we had been using into XML, then adding it back to the original XML. I decided against this however, as any tiny issue with the XML would cause the workbook to crash when opened. To change as little as possible, I output a lookup table from my macro with 2 fields: The RecordID of the XML line, and the new "id" value that needed to be added to that line. I used the regex_replace function to insert these new values into the XML just after it had been imported, in order to change as little as possible:
To output this, you can use a .csv format with a "\0" delimiter. This process was easier than I initially had thought, but making it fully automated and integrated with Server was a lot harder and will be what I focus on in the next couple of blogs. I hope this one helps some people trying to learn about Tableau focus order and XML hacking in Alteryx!