


Today's dataset had more information than you would ever need about buildings in Switzerland. The shape of every room, how much sunlight they receive, how many mountains you can see from the windows... you get the idea. I decided I wanted to make a dashboard to find the user their perfect Swiss house by choosing how important certain features are to them.
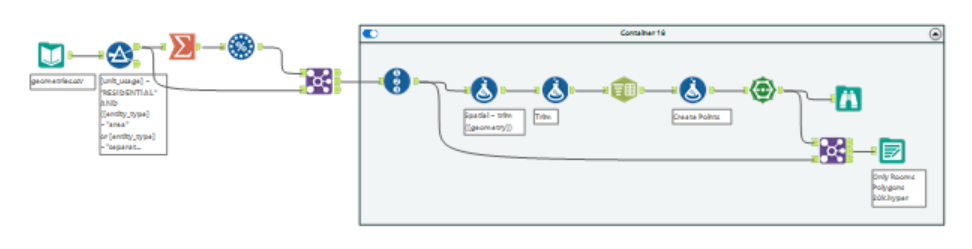
The first challenge was dealing with the shape data - which was helpfully in a format that neither Alteryx nor Tableau could properly interpret. With some help from Google, I managed to parse out the individual points from each shapefile and reconstruct them into spatial objects.
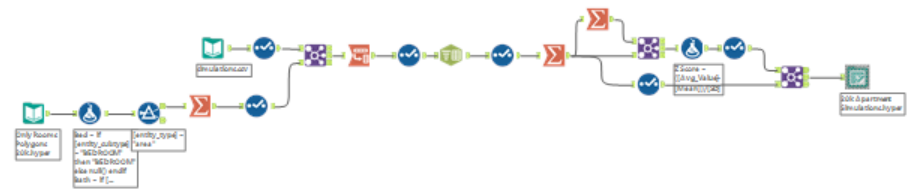
I wanted to allow the user to choose features that were important to them and score the houses accordingly. To do this I needed to standardise each of the measurements I wanted to use: sunlight, noise levels, view, area and number of rooms. I used Alteryx to calculated Z-Scores for each of these metrics - this is what the workflow looked like:
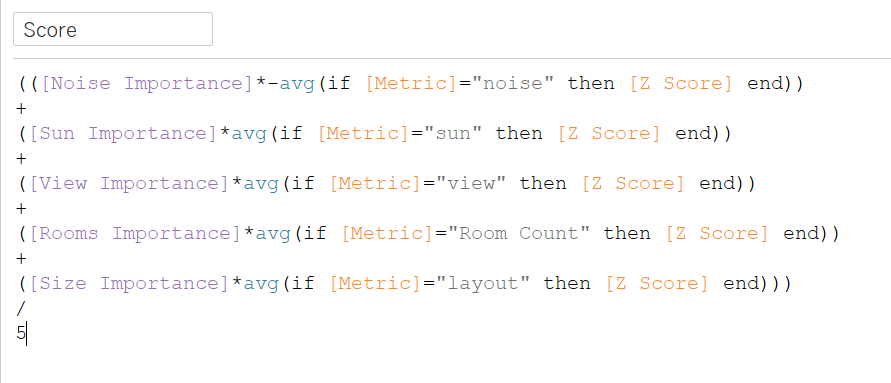
Now to make the dashboard! The bulk of it was making the floorplan and then being able to generate a score for each house based on the parameters the user chose. Here's the calculation I used for that:
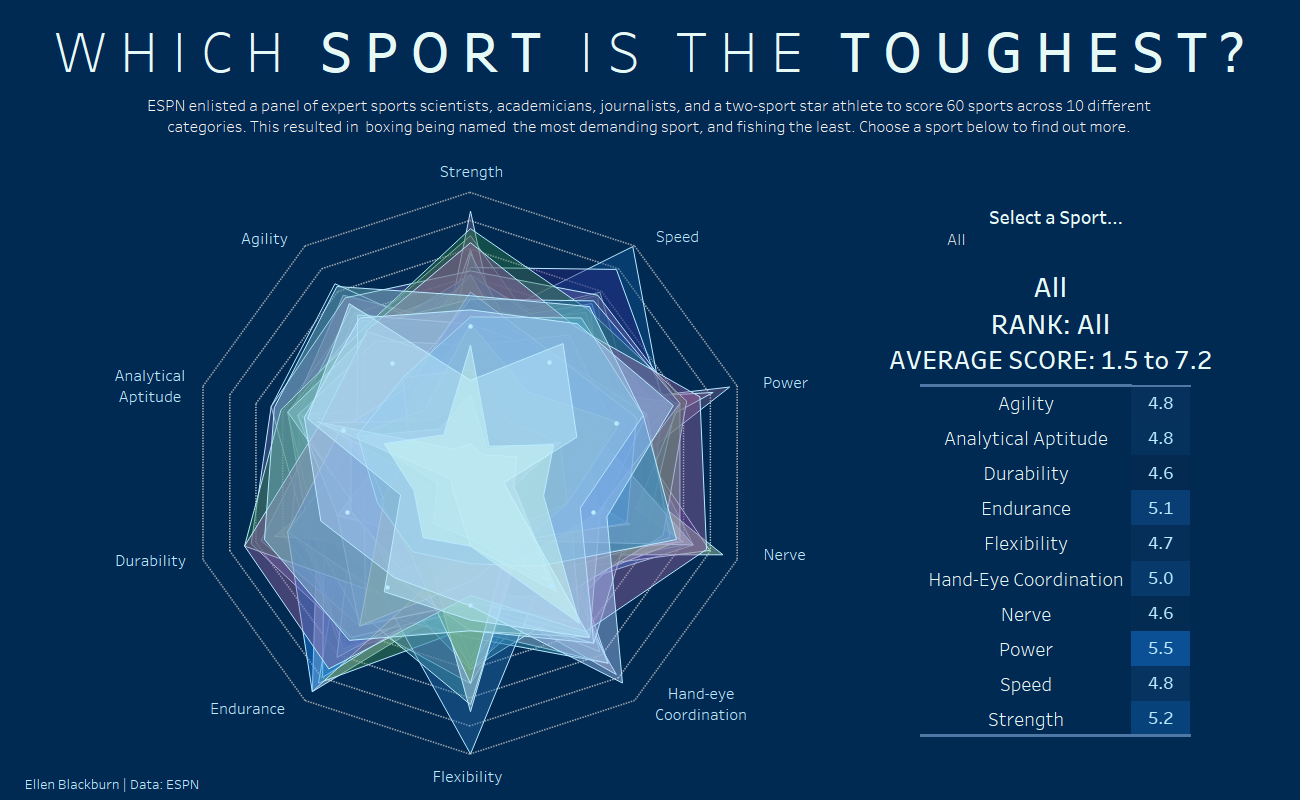
The only other tough part was the radar chart, although it was made much easier by Ellen Blackburn's amazing blog which I can't recommend enough:
By 3pm it looked like this:
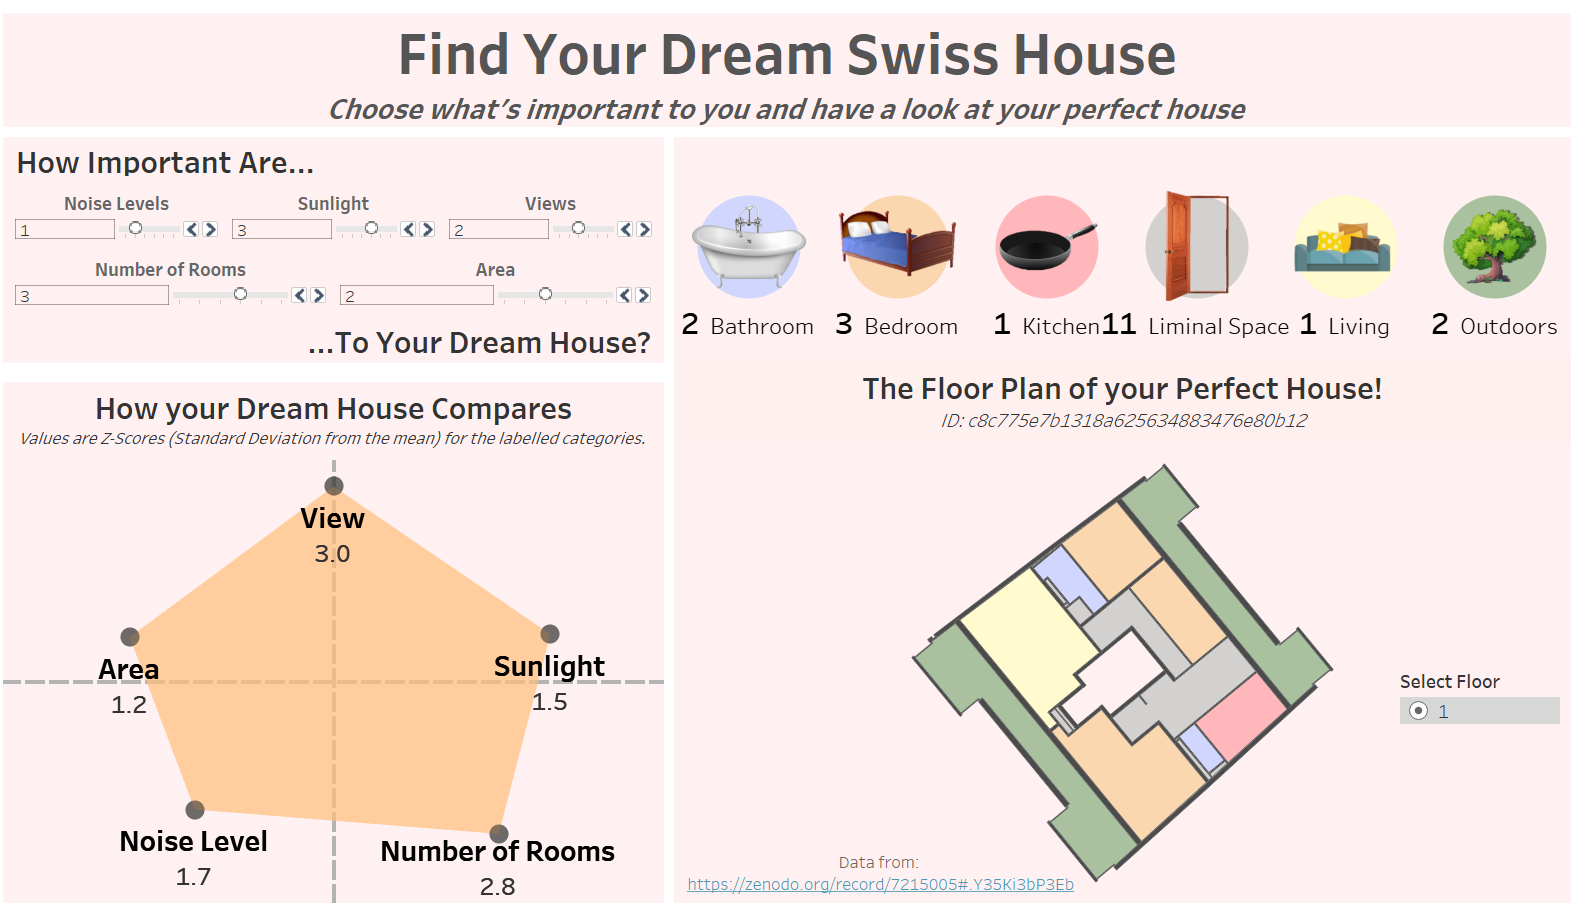
The parameters in the top left are used to select how "important" each factor is for you, on a scale of 0-5. The whole dashboard filters to show the top-scoring house for your chosen parameters. Overall this was a tough task but quite fun in the end!