


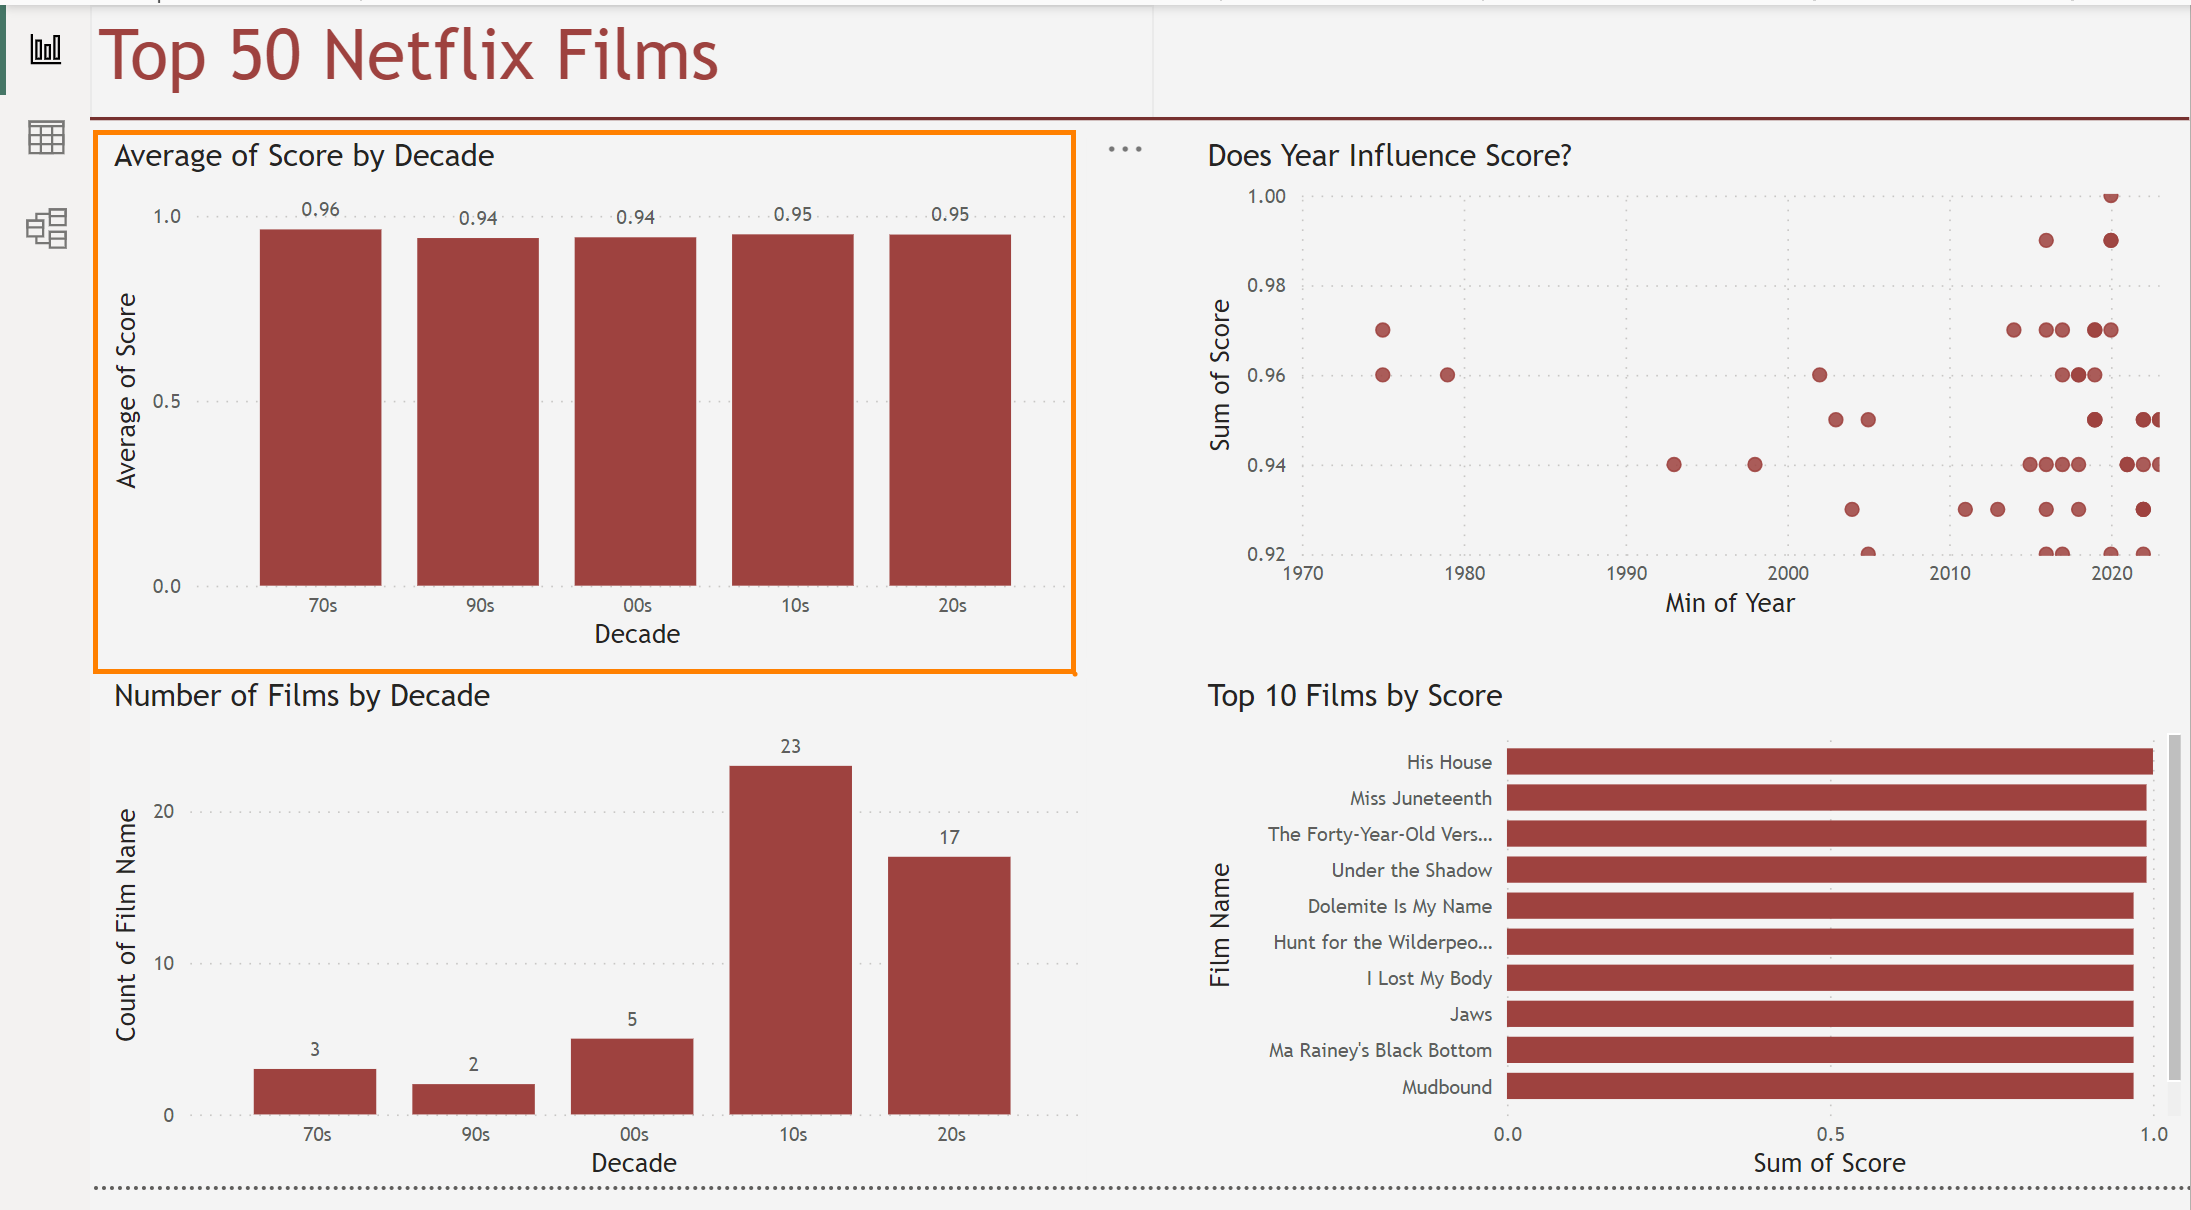
Say, our goal is to create the first chart on this dashboard: Average of Score by Decade
Here are the steps
Once we have all the data fields (average score and decade) in the view:
- Bring in the date field (in our example it's 'Year') to make sure it is somewhere in the view, even though we're not using it in our chart. We can do this by simply dragging the date field to tooltips.
- Change the aggregation of the date field (i.e. 'Year') from sum to either Minimum or Maximum
- On the chart, select the ellipses (3 dots) on the top right corner. Then under the 'Sort axis' option: select 'Max of Year' and 'Ascending'.
If it doesn't automatically sort by date, go to the table view and make sure that the date column is sorted in ascending order.
0:00
/