


For dashboard week day 4, we were assigned with the task of visualizing survey data about American candy from 2014-2017. Data prep had to be done using Tableau Prep in the browser, along with building a dashboard via web authoring. We were allowed to supplement the data with additional data, but I did not.
Although Andy said that this project isn’t very complicated, that was not the case for us here in NY. At one point, we all were having trouble with Tableau server. Tableau prep on the server did not want to load for a while, which ate up a chunk of our time. I learned that I need more Tableau prep experience as I’m not as confident in it.
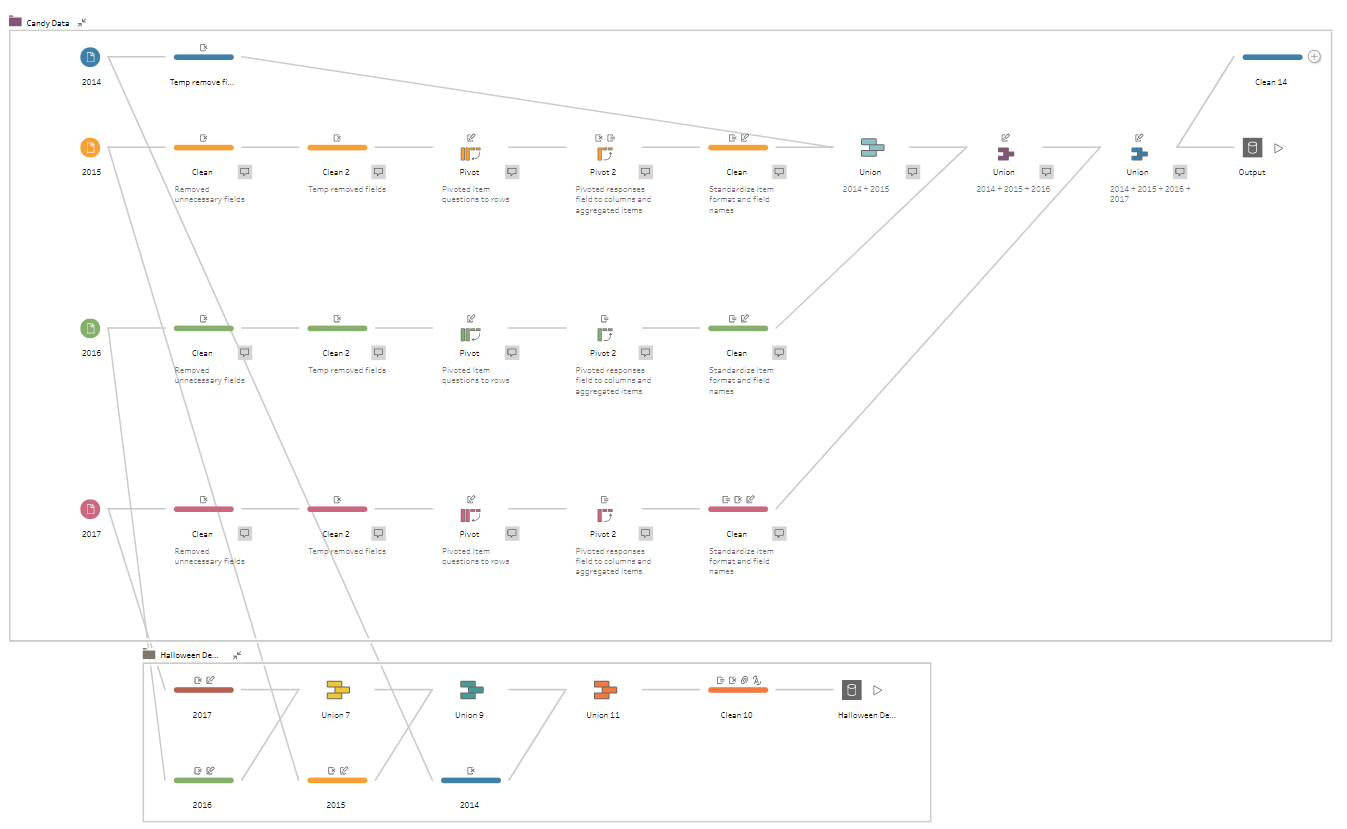
Some people were having trouble connecting all of the datasets, but I was able to join together all four years with help from Kinley (DSNY2) as shown below. However, I had to remove some of the columns in order to join them and I created a separate output with some of the removed columns for later use in Tableau. Afterwards, I learned from Ann Jackson that I could have put all the joins into one tool instead of four separate ones by dragging the clean tool to the left of the join tool. I did not implement that change here, but it is possible!
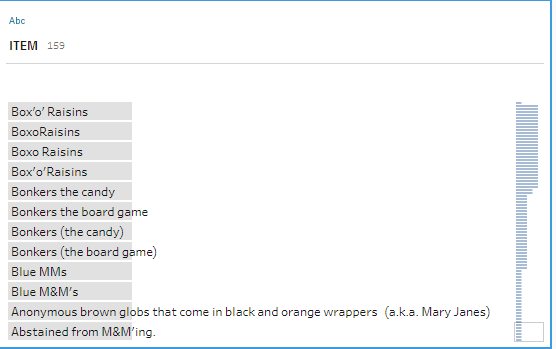
Once I was done cleaning and joining, I did some more cleaning in Tableau on the server as survey data is often pretty messy. Honestly, most of my time spent was on cleaning the candy column on both Tableau prep and Tableau. There were so many responses that were essentially the same item, but spelled differently, along with some non-candy responses.
As a result of the long cleaning, I did not have as much time as I would have liked for EDA and working on my dashboard. Essentially. I wanted to look into the demographics of trick or treaters and what items received during Halloween give them the most joy or despair. I’m hoping to clean up the data even more and the dashboard this week.
References:
Candy data task:
The Data School - Dashboard Week Day 4 - American Candy Survey
Candy data:
So Much Candy Data, Seriously | SCQ
Tableau Public: