When using a parameter in Tableau Desktop or Public, it can be tricky to fix the formatting if a few of the fields within the parameter have different number formats. For example, you may want to use a parameter to allow the user to change between currency, rates and percentage fields in one view. In this post, I talk about this issue, and how to get around it.
Makeover Monday Live
Just over two weeks ago The Information Lab: Data School hosted a Makeover Monday Live evening. Andy and Eva talked through a little about Makeover Monday and then gave us one hour to create a visualisation from some data. They even put a timer up on the screen to give added pressure! There were about 20 people and we analysed the DC Metro dataset used originally in December (W51) 2016.

It was really interesting to just have an hour to get into a dataset, work out what it’s saying and a way you’d like to visualise that. This was an interesting challenge because I am a perfectionist and like to spend time on the little things, so to just have one hour was daunting. But it helped that we were all in the same boat and collaborated together to help each other with ideas and how to do things. It was really fun and I think I need to do that more often, spending just an hour or two rather than deliberating over visualisations for hours/ days.
That week at the data school we’d looked at parameters so, naturally, I decided to put all the variables from the data set onto one chart, allowing the user to toggle through them using a parameter.

However, whilst I ‘completed’ the viz in the hour, afterwards I noticed that I’d made a couple of mistakes:
- The variables had different formats: some were numbers and others were percentages
- The crime and injury rate colour indicators were the wrong way around – the crime numbers were good if they were under the target, not over it, unlike the bus times etc.
I quickly corrected the colour issue by using a Boolean calculated field and editing the Alias’. However the parameter number formatting was a trickier solution though!
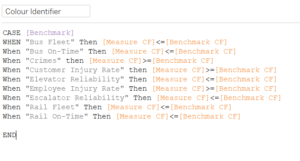
Boolean calculations for the colour indicator
How to have different number formats within one parameter
The solution: Measure Values to the rescue! Create and use new measures as labels. Here are the few steps I used to solve the problem:
1 – Create a label calculated field for each variable in the parameter, linking the original field to the parameter. To help me in step 2, I’ve labelled these Percent and Number. This can be a lengthy process, depending on the number of variables used in the parameter – I had 9 to create!

2 – Assign each of these Label variables a default format. Right click on each pill and select Default Properties > Number Format.
I formatted the percentages with 1 decimal place and the numbers to standard numbers with no decimal places.
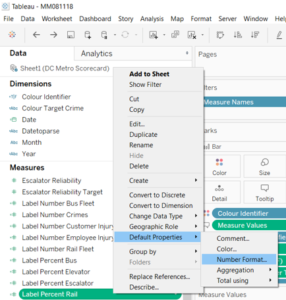
3 – Put these fields on the label shelf on the marks card. This can be done by selecting all of the label pills and dragging them onto the view. However, I found that a cleaner way to do it was to use the Measure Values pill.
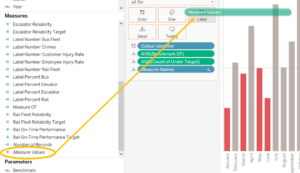
I dragged this onto the labels and then just kept the label variables. Doing it the later way also means you can use them in a Tooltip by holding the Ctrl key and dragging the Measure Values pill onto the tooltip.
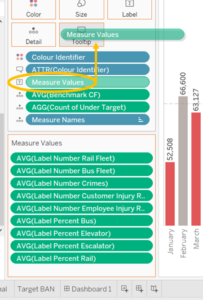
4 – Allow marks to overlap. Right click on the label shelf on the marks card and check ‘Allow marks to overlap’
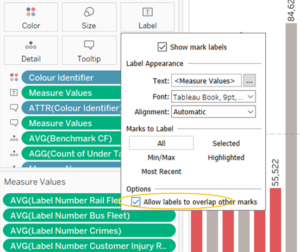
And there you have it – a way of formatting different variables in a parameter! View and download my final Tableau Public viz here.
There are lots of regular, free events hosted by The Information Lab: Data School so check out the LetsTalkData Meet Up group. Also see Andy’s blog and video on the topic.
