


May is Asian American and Pacific Islander (AAPI) Heritage Month; for this reason, I want to build Tableau vizzes celebrating AAPI culture, community, and accomplishments this month.
Sip Sip Hooray! Bubble Tea Shops in NYC
I started with a bubble tea viz. Bubble tea, or boba, is both a refreshing drink and a symbol of Asian American culture. It gathers friends, carries comfort, and celebrates my Asian heritage. I also wanted to complete another API project, after my first Dungeons & Dragons one.
I used the Yelp Fusion API to retrieve data on bubble tea shops in New York City. According to the documentation, the API can only return up to 1,000 results at this time. Thanks to the help of Peter Silvester, I divided my search into the five boroughs of New York City. Thus, I had five streams within my workflow:
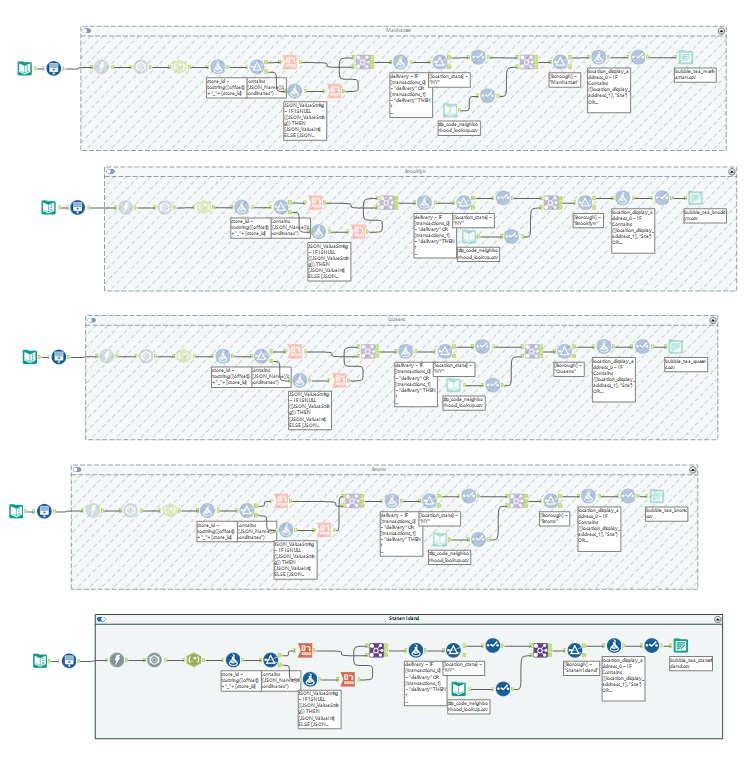
A batch macro may be more efficient, but I copied and pasted the streams to edit the location, pulled the data I needed, and moved into Tableau to visualize. In starting this visiualization, I thought about Dennis Kao, who creates amazing map-based visualizations in Tableau. Although I didn’t perfectly emulate his style, it was fun to plot all the bubble tea spots onto a map of the city and employ parameter actions to transform the black “tapioca pearls” into pink strawberry ones.
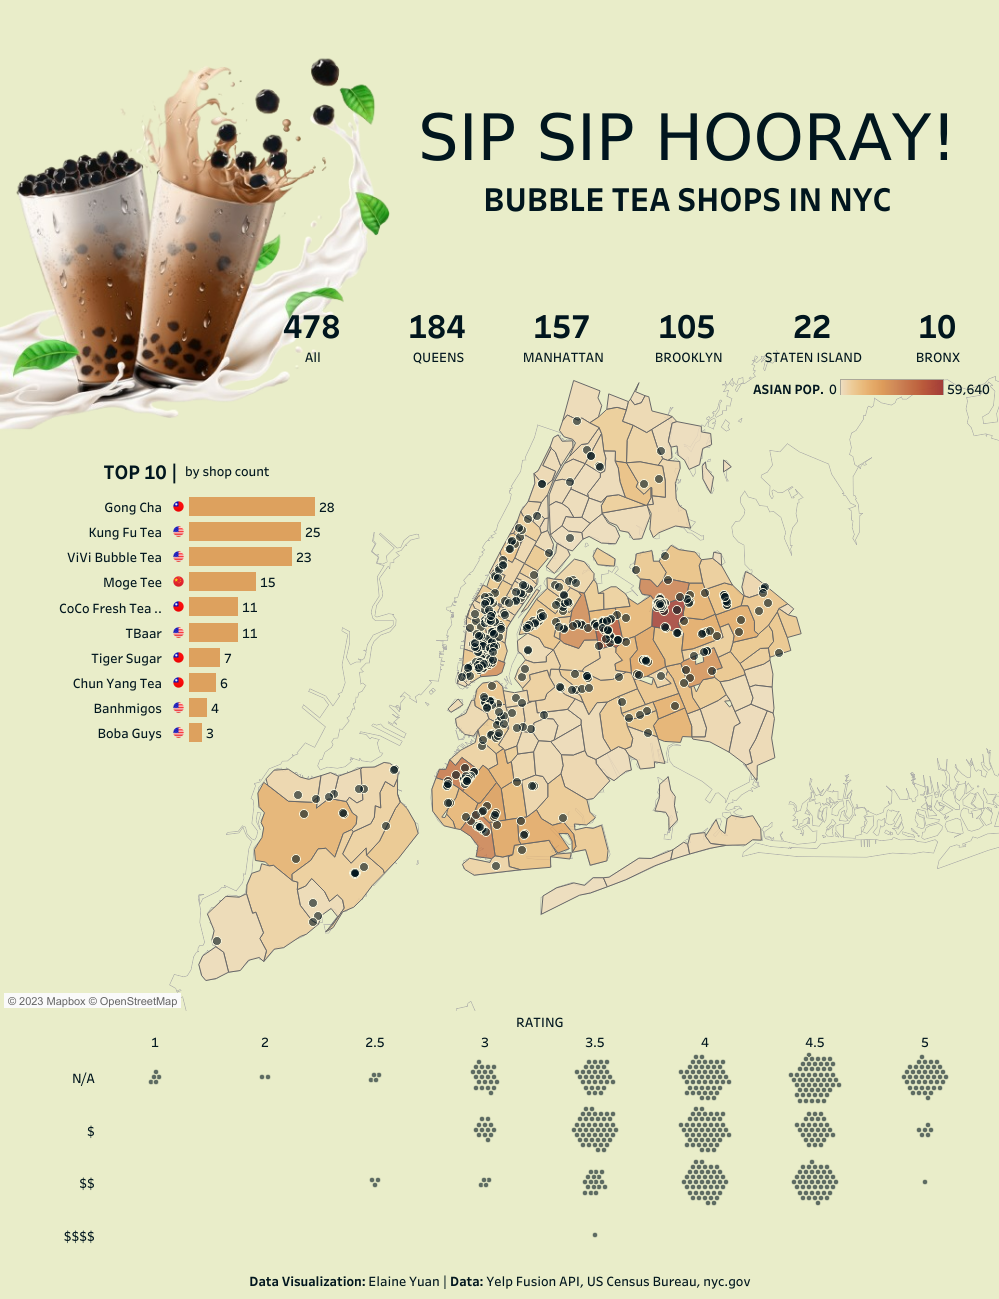
In my analysis, I found that:
🍃 even though Queens has the greatest number of bubble tea shops, Manhattan has a greater ratio of shops to Asians with 80 shops per 100,000 Asians
🍃 although Gong Cha has the most locations in NYC, the list of top 10 by shop count includes brands born in New York, such as Kung Fu Tea and ViVi!
🍃 other people think Machi Machi is overpriced ($$$$)
🍃 the closest CoCo to the office is not present in the data, so this dataset is incomplete and overcoming the limitations of the Yelp Fusion API is harder than I thought
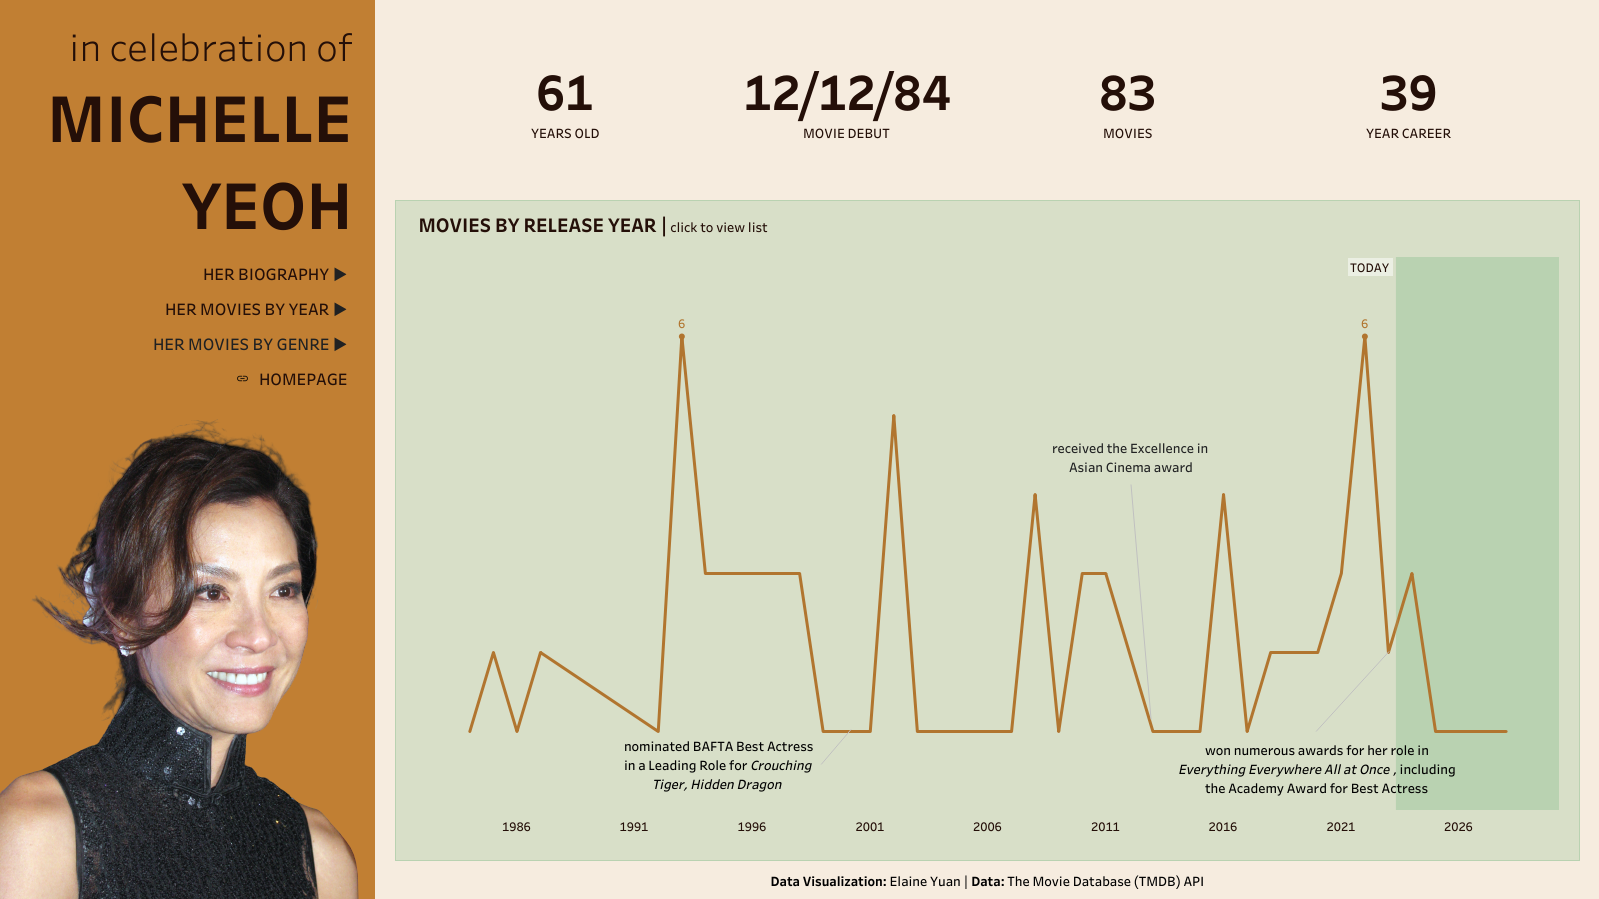
in celebration of Michelle Yeoh
In brainstorming AAPI topics I could viz this month with Vivian Ng, we talked about Asian representation in American media. I immediately thought of Michelle Yeoh, who won numerous awards this year for her role as Evelyn Wang in Everything Everywhere All at Once, and her remarkable career from Hong Kong action films to Hollywood. I knew I wanted to visualize her success in a Tableau dashboard.
This is another API project; here, I’m fetching data from The Movie Database (TMDB) API. There were two main streams this time – one to get movie and TV credits and another to get her profile:
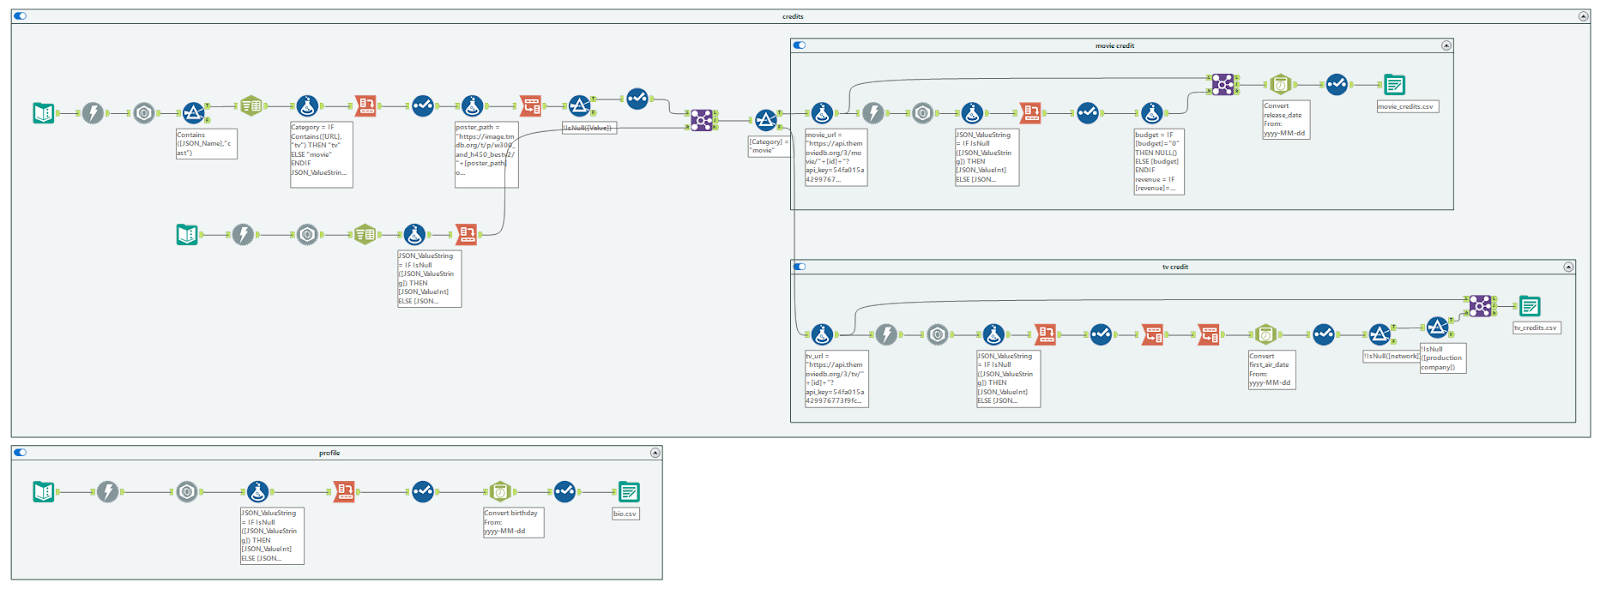
After examining the data I pulled, I ultimately decided to just visualize her movie credits because it was a more complete dataset. For example, the TV credits included her guest appearances on shows, like The Late Show with Stephen Colbert and The Graham Norton Show, but did not specify the episode’s air dates.
My resulting viz is akin to a traditional dashboard with a sidebar with navigation and a banner of big numbers. It was fun to use dynamic zone visibility in two ways in this viz; one is based on parameters (for the navigation) and the other is based on sets (for the movie list). I finally used image roles outside of a Workout Wednesday too!
In this personal project, I learned:
👑 Michelle Yeoh started acting at the age of 22
👑 now at 61 years old with a 39-year acting career, she has spent almost ⅔ of her life on-screen blessing us with her talent and beauty
👑 there is a “gap” from 1987-1992 in the line graph because she retired from acting when she married and returned to acting after divorce
👑 she’s a Bond girl?! I need to watch more of her movies.
As suggested in the title of this blog post, this is the first installment of my AAPI Heritage Month vizzes. I hope to produce more in the second half of this month and share them in a second installment. I will also share my work via my Twitter (@datadrawnYuan) and LinkedIn (yuanelaine). So stay tuned for more content for AAPI Heritage Month.