


Making the Chart
A waterfall chart is created with a measure that can be both positive or negative broken down by a dimension or multiple. Thus to start we are going to want a measure and a dimension in the rows and columns shelves respectively. Using Superstore for the example a measure like profit fits the description whilst we could use subcategory or a discrete date as a dimension to split up the data and visualize a part to whole relationship.
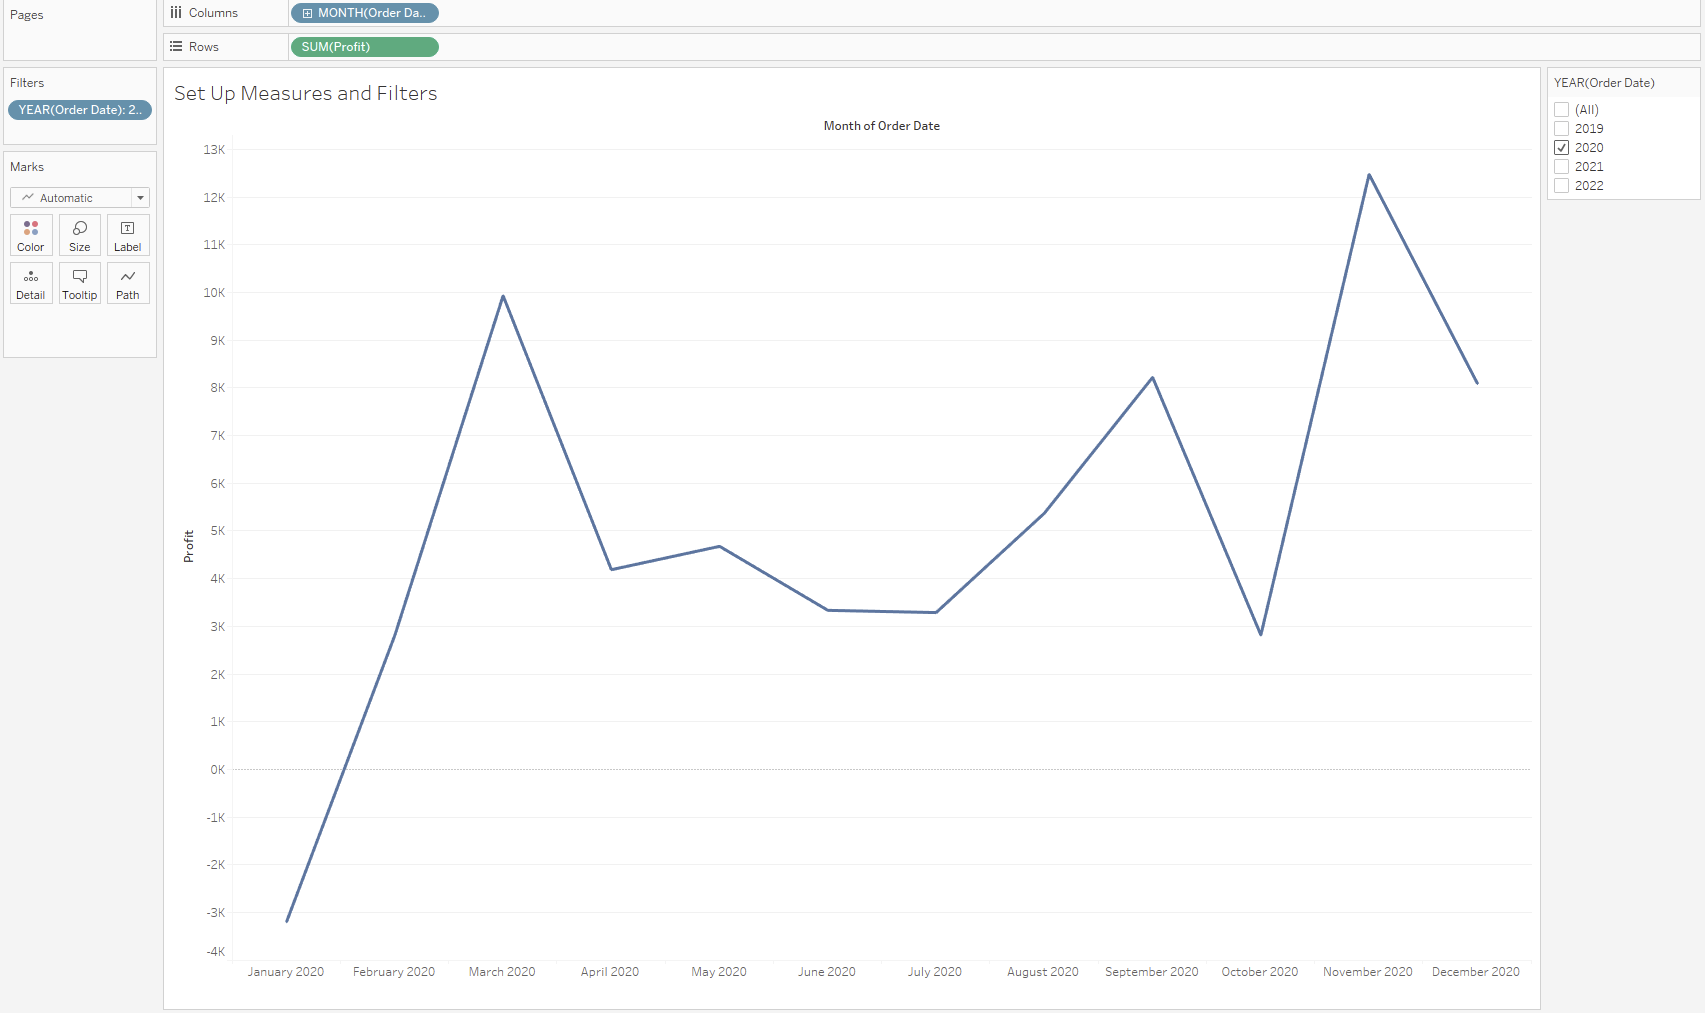
Here I have filtered to a single year for a use case and we could therefore forgo the year information in the column headers but I have included them here just to further illustrate the data has been filtered.
Ultimately a waterfall chart shows part to whole so I think an important contextual detail is to add a totals column in the analysis pane:
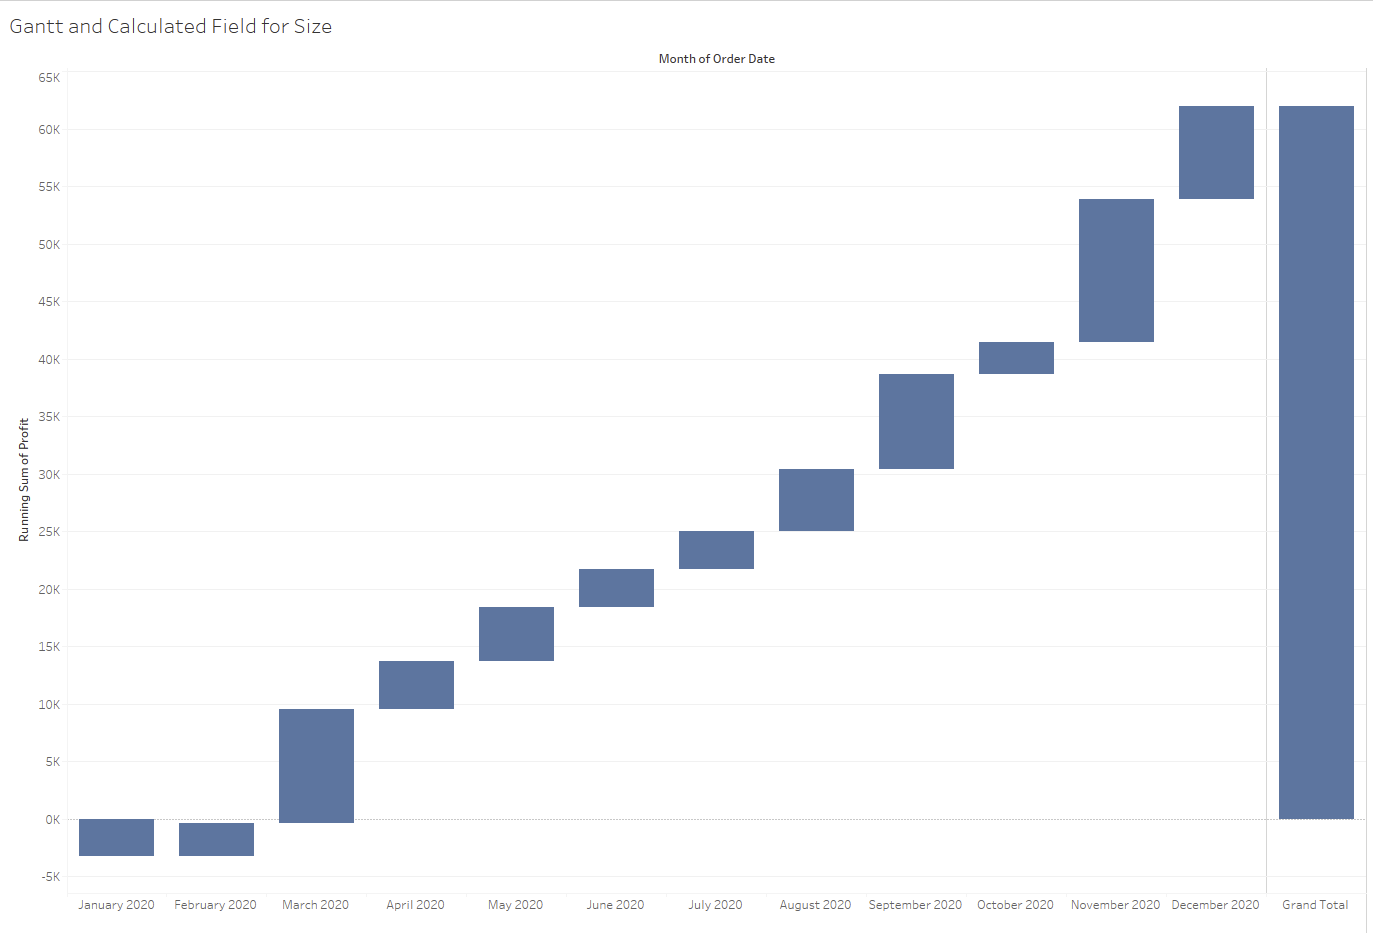
Now we have set the context of what the whole is we are going to want to use a quick table calculation to turn our measure into a running sum:
Now in order to mark the contributions to the total we want to change the marks type to Gantt Bar:
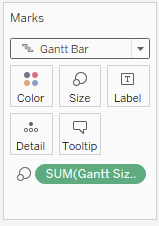
And use a calculated field to get the correct size of Gantt:
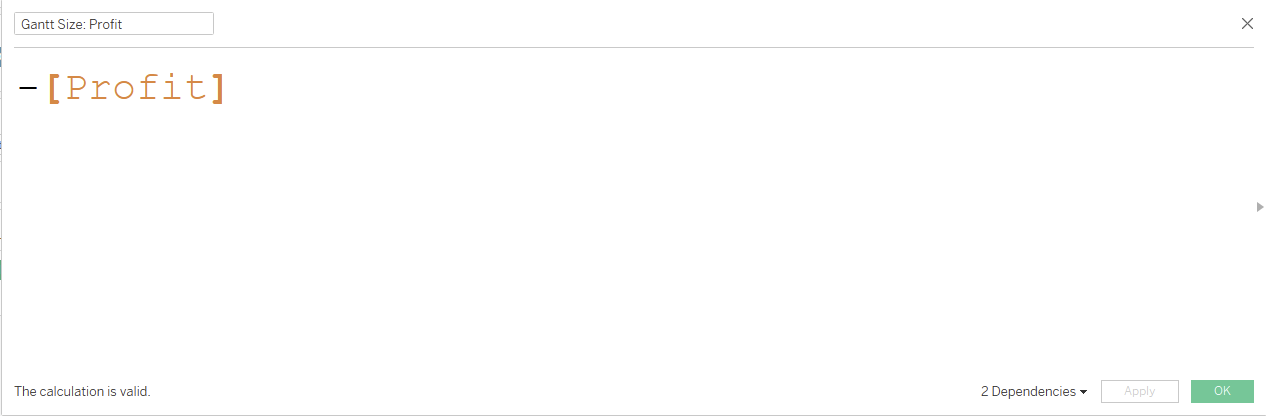
In this instance the negative version of the measure. This has the effect of telling the Gantt to be the size of the measure contribution for that part of the dimension but in the direction of where the running sum total ended for the previous part:
Now all that remains is formatting:
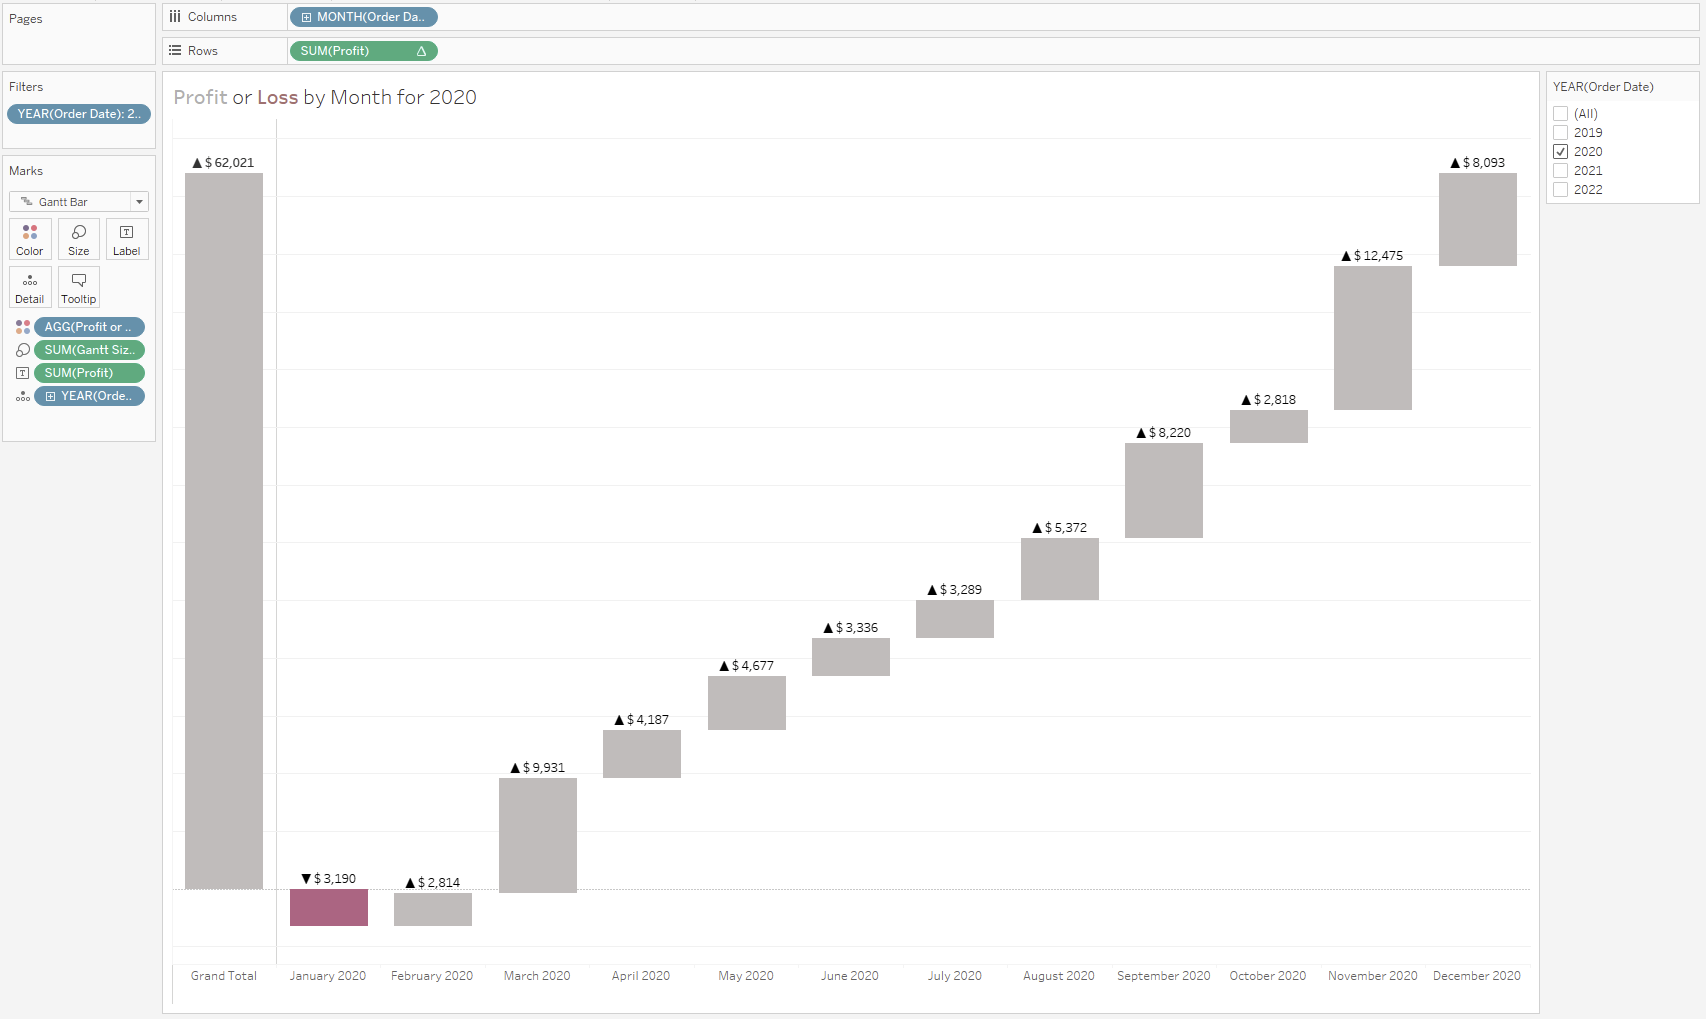
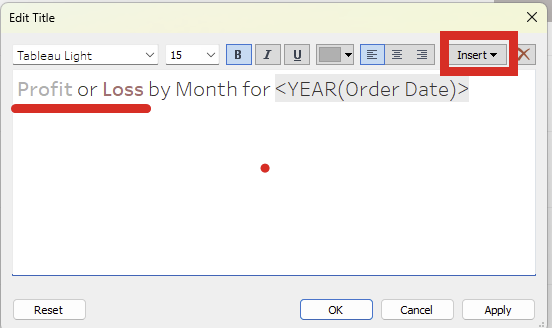
I have control dragged my filter into the details pane in order to use that information in the title and have it dynamically update, this is added with the insert pane in the top right. I also used the title as a color legend.
I have moved the Grand total to the left so it is read first more naturally and helps set context - this is achieved by right-clicking the Grand Total Column Header and selecting Row Totals to Left.
I also added a boolean field for whether the profit was positive or negative to color to more quickly identify when a month did not have a positive product and was thus detracting from the whole.
Finally I used custom formatted labels to clearly show the size of the Gantt bar as the scale is of less use for a chart like this. I dragged sum(profit) onto the label and right-clicked the pill to select the formatting option before setting it up as follows:
▲ "$" #,#;▼ "$" #,#
The semi-colon instructs Tableau to treat positives and negatives differently (a further semi-colon would instruct on how to treat zeros).
Analyzing the Use Case
Having built a waterfall chart it is worth reflecting on what they can be good for and when it might be better to opt for a different chart.
A waterfall chart displays a part to whole relationship, but allows for parts to both contribute to the whole or detract from the whole fairly clearly (bar going in the wrong direction). This can be further highlighted through the use of color.
A waterfall chart allows for fairly quick identification of the parts of the dimension that contribute most to the whole (i.e. the largest bars). Although if the story is more of a magnitude one, i.e. which part is biggest then a bar chart is probably more effective as the marks start from the same point on the axis and are therefore more comparable. This problem could be tempered by labeling to make the magnitudes clearer on a waterfall.
I think a waterfall chart is at its best when it has the totals column to set the context of what is being worked towards or else its part to whole nature is less clear to more casual viewers.
There is an opportunity to express time in a waterfall without explicitly using a time based variable: by ordering the parts of a dimension in chronological order it can begin to tell a story of changes over time. However, if this is the desired message it might be better to use a cumulative line chart given that standard practice is often to use a line chart for something that occurs over time and therefore the message can be picked up by a viewer faster.