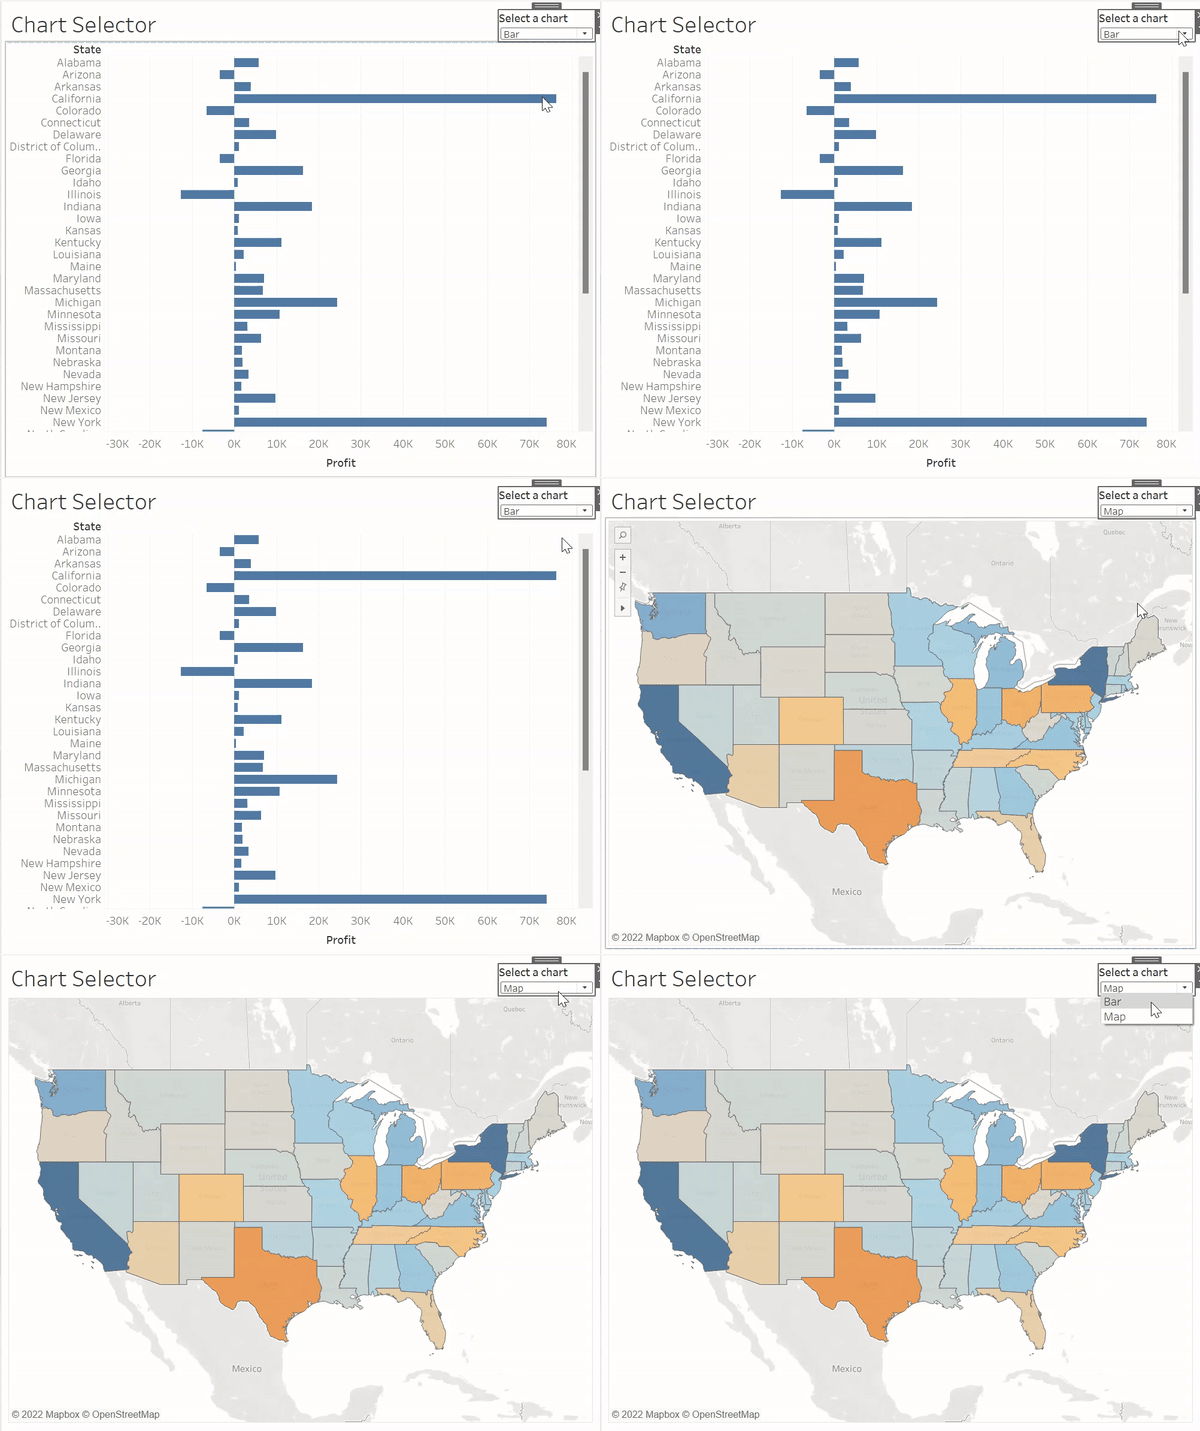
Fitting all your sheets into a dashboard can be difficult. Sometimes you may want to give your user a choice between charts. Here's a guide on setting up a parameter to do just that.
Step 1: Create your parameter
This parameter will be your sheet selector, so you'll want to create a list of sheet names to choose from. To set this up use the data type 'string', set allowable values to 'list' and type in the name of each chart type you wish to include.

Step 2: Create a calculated field
In order to use our parameter as a filter we need to set it up in a calculated field. Simply create a new calculated field and type in your new parameter name.

Step 3: Use the calculated field as a filter
We want our sheets to disappear when they're not selected by the parameter. To do this we can use our parameter as a filter. Drag the new calculated field into the filters card and go to the conditions tab.
Select the by formula option and set your parameter equal to the sheet you want to select. In my example I've added this filter to my bar chart so I've written: [Select a chart]='Bar'.

Repeat this step for each of the charts you want to include in your dashboard (be careful with how you write your parameter options and formulas as it's case sensitive).
Step 4: Create your dashboard
Now that your sheets and parameter are sorted, it's time to place them into your dashboard. Drag a container from the objects pane into the dashboard. Now drag the sheets you want to use into the container, stacking them vertically. Right-click on each of the sheets to hide the titles and display your parameter.
If you've followed each step correctly your final product should work just like this:

