


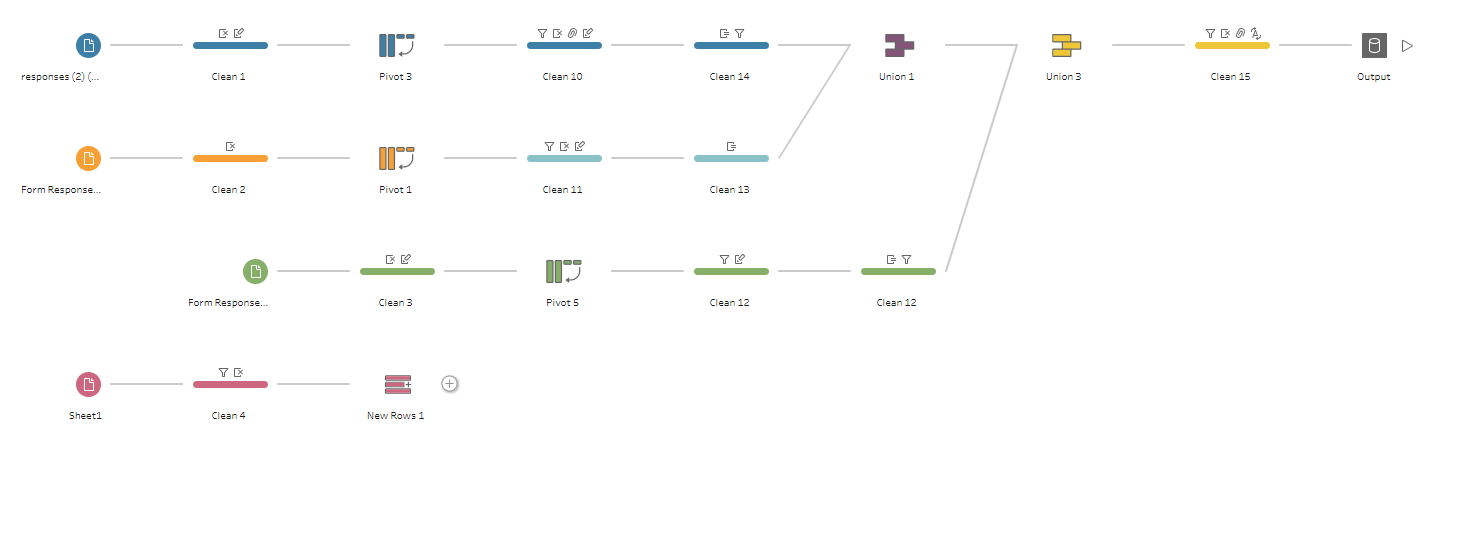
Today was another odd task, for one the data was from surveys held by a candy company, and also because our data prep was limited to using Tableau Public in browser and we could only create the dashboard using Tableau in Browser. The data itself was very strange and needed a lot of cleaning, firstly because it there were 4 tables from the 4 different years the survey was completed, and these tables all had different formatting. Not to mention most of the input boxes were text input so there was little consistency between answers, also the majority of the survey questions were multiple choice for different candys with either 'Joy' 'Meh' and 'Despair' as the options. This once again left little room for creativity when it came to analysis as there was no consistent score to track.
Doing the prep work in browser came with its own complications as there were a number of bugs and issues we ran into when creating the flow. I ended up not using the earliest data set as it was a completely different format and I could not work out how to transform it into the same as the others and neither did the people that I asked.
Another Quirk with the data was that not all questions were about candy, some of them were about random stuff like tv shows and glow sticks. While others chose to exclude these columns I decided to keep only them, opting to create a dash that had nothing to do with candy at all. This limited my data slightly but I felt it would make for a more interesting dash and more different from my peers.
The Plan once I had the data was to create a dash that allowed users to see the most and least joyful 'things' for their age and gender, as well as the most controversial things.
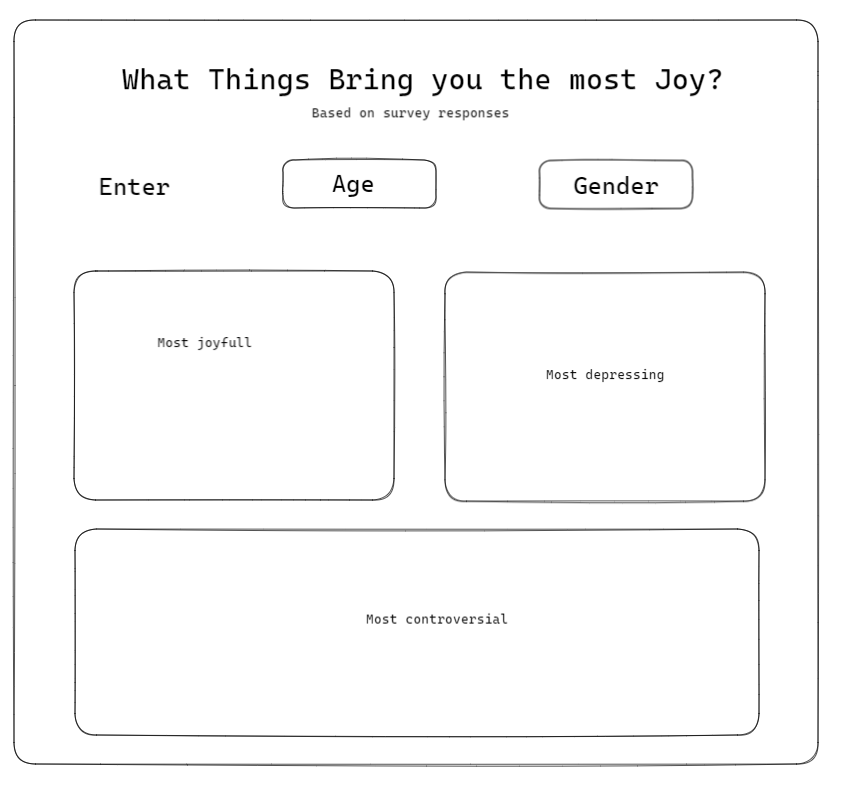
The end output was pretty true to the start excalidraw but it certainly wasn't my proudest body of work as I did not have as long to create it as I would have liked and using Tableau in browser slowed things down a lot as things were not in the same location, some features simply don't exist and this meant I spent a lot of time trying to do something I could do instantly in desktop.
In Hindsight I may have chosen to do less in prep to give me more time to create my dash but I also feel I should have planned a more complex dashboard from the start.