


Today is the last day of the capstone project and of training! My plan for today was to begin finish my dashboards in the morning then work on my presentation and dashboard demos.
Polishing Up My Dashboards
This was my executive view from yesterday:
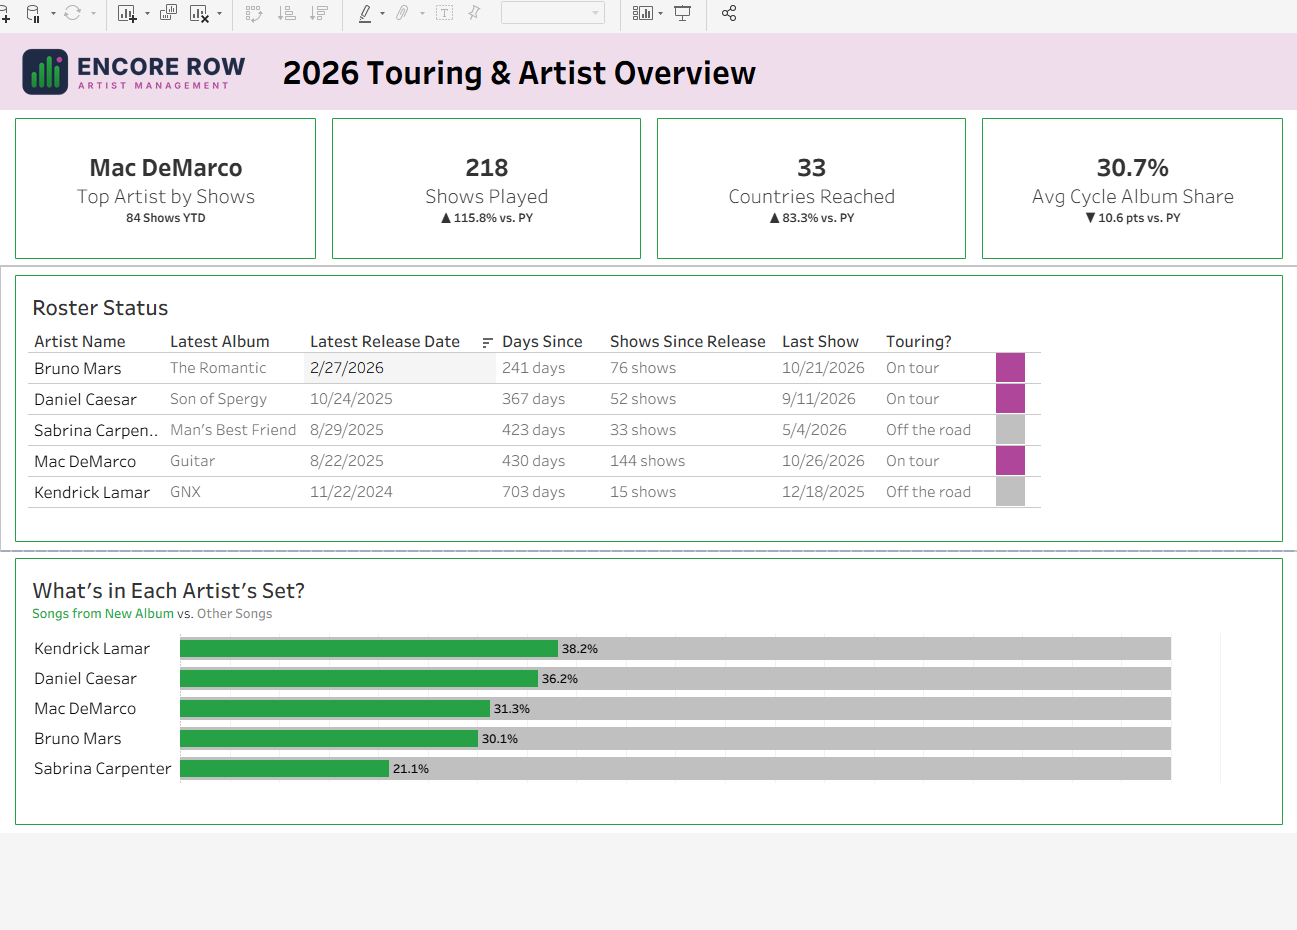
And here's the finished view:
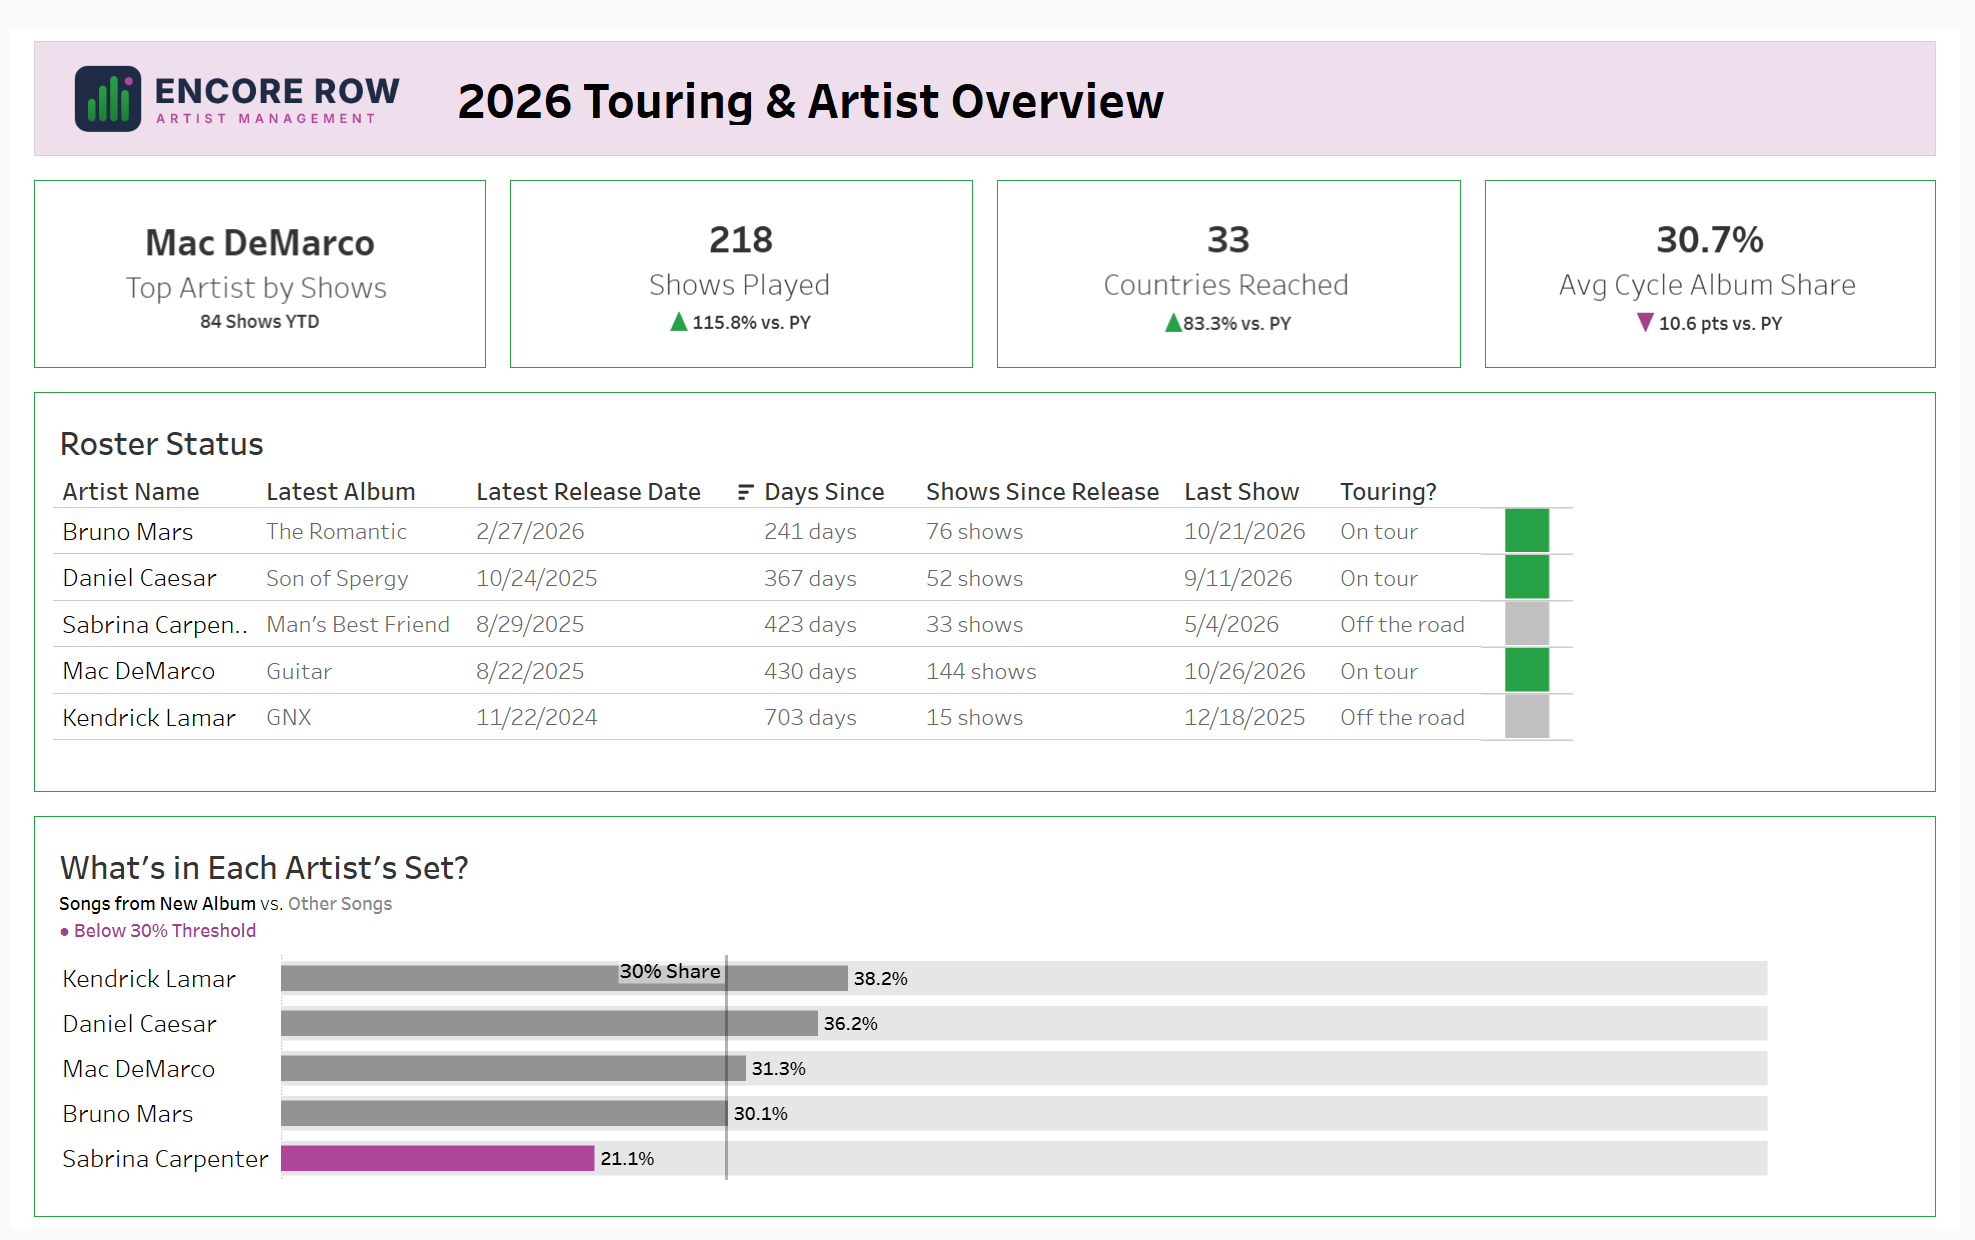
What I Did: I first wanted to make color more intentional. So, I made sure to note that purple was negative and green was positive. With that, I was able to update the KPIs to have green arrows if a positive change, and purple arrows if a negative change. I was struggling to figure this out at first, but got some help from my peers. I needed to create 2 extra calculations that would go in the text box. One is the negative change arrow, and the other is the positive change arrow. The below calculations say if the value is positive, show the up arrow. If it's negative, show the down arrow. Only one can be true at a time, so if one returns an arrow, the other will return an empty string.
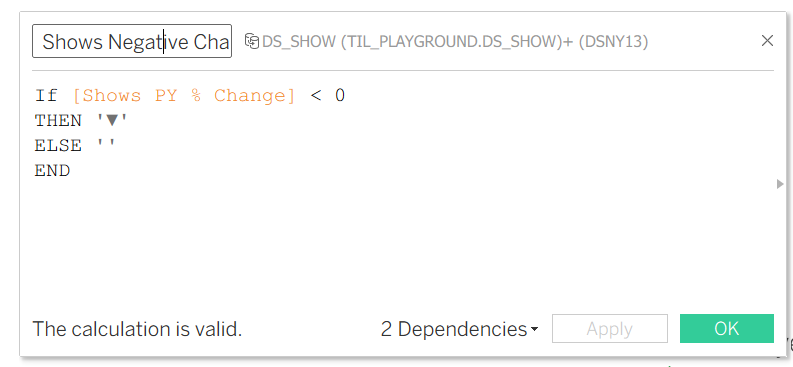
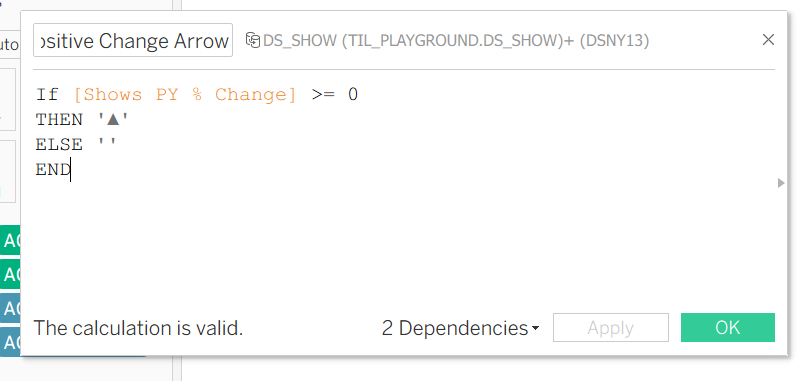
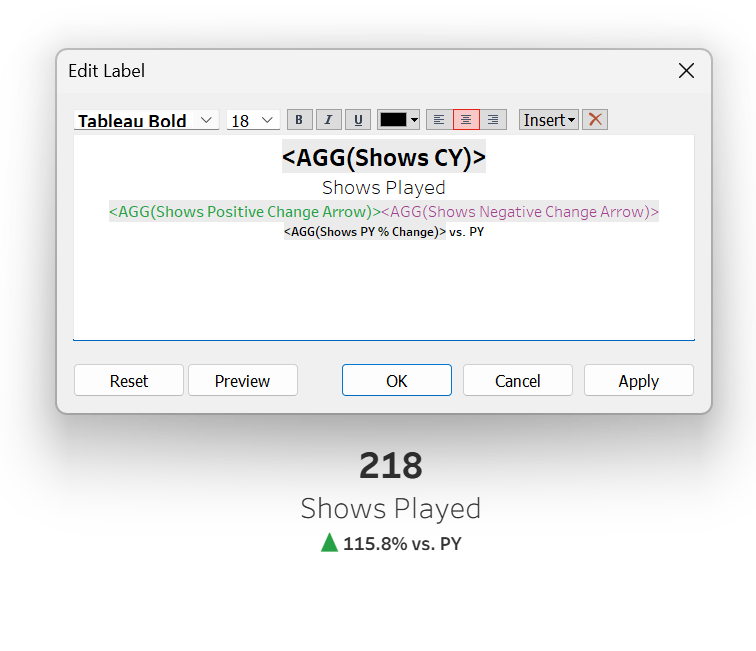
You have to insert both the positive and negative arrow fields in the text label, color them appropriately, then it will return only one of those arrows depending on which is true. I thought this was a really useful Tableau trick for color use so I thought I'd share how to create this.
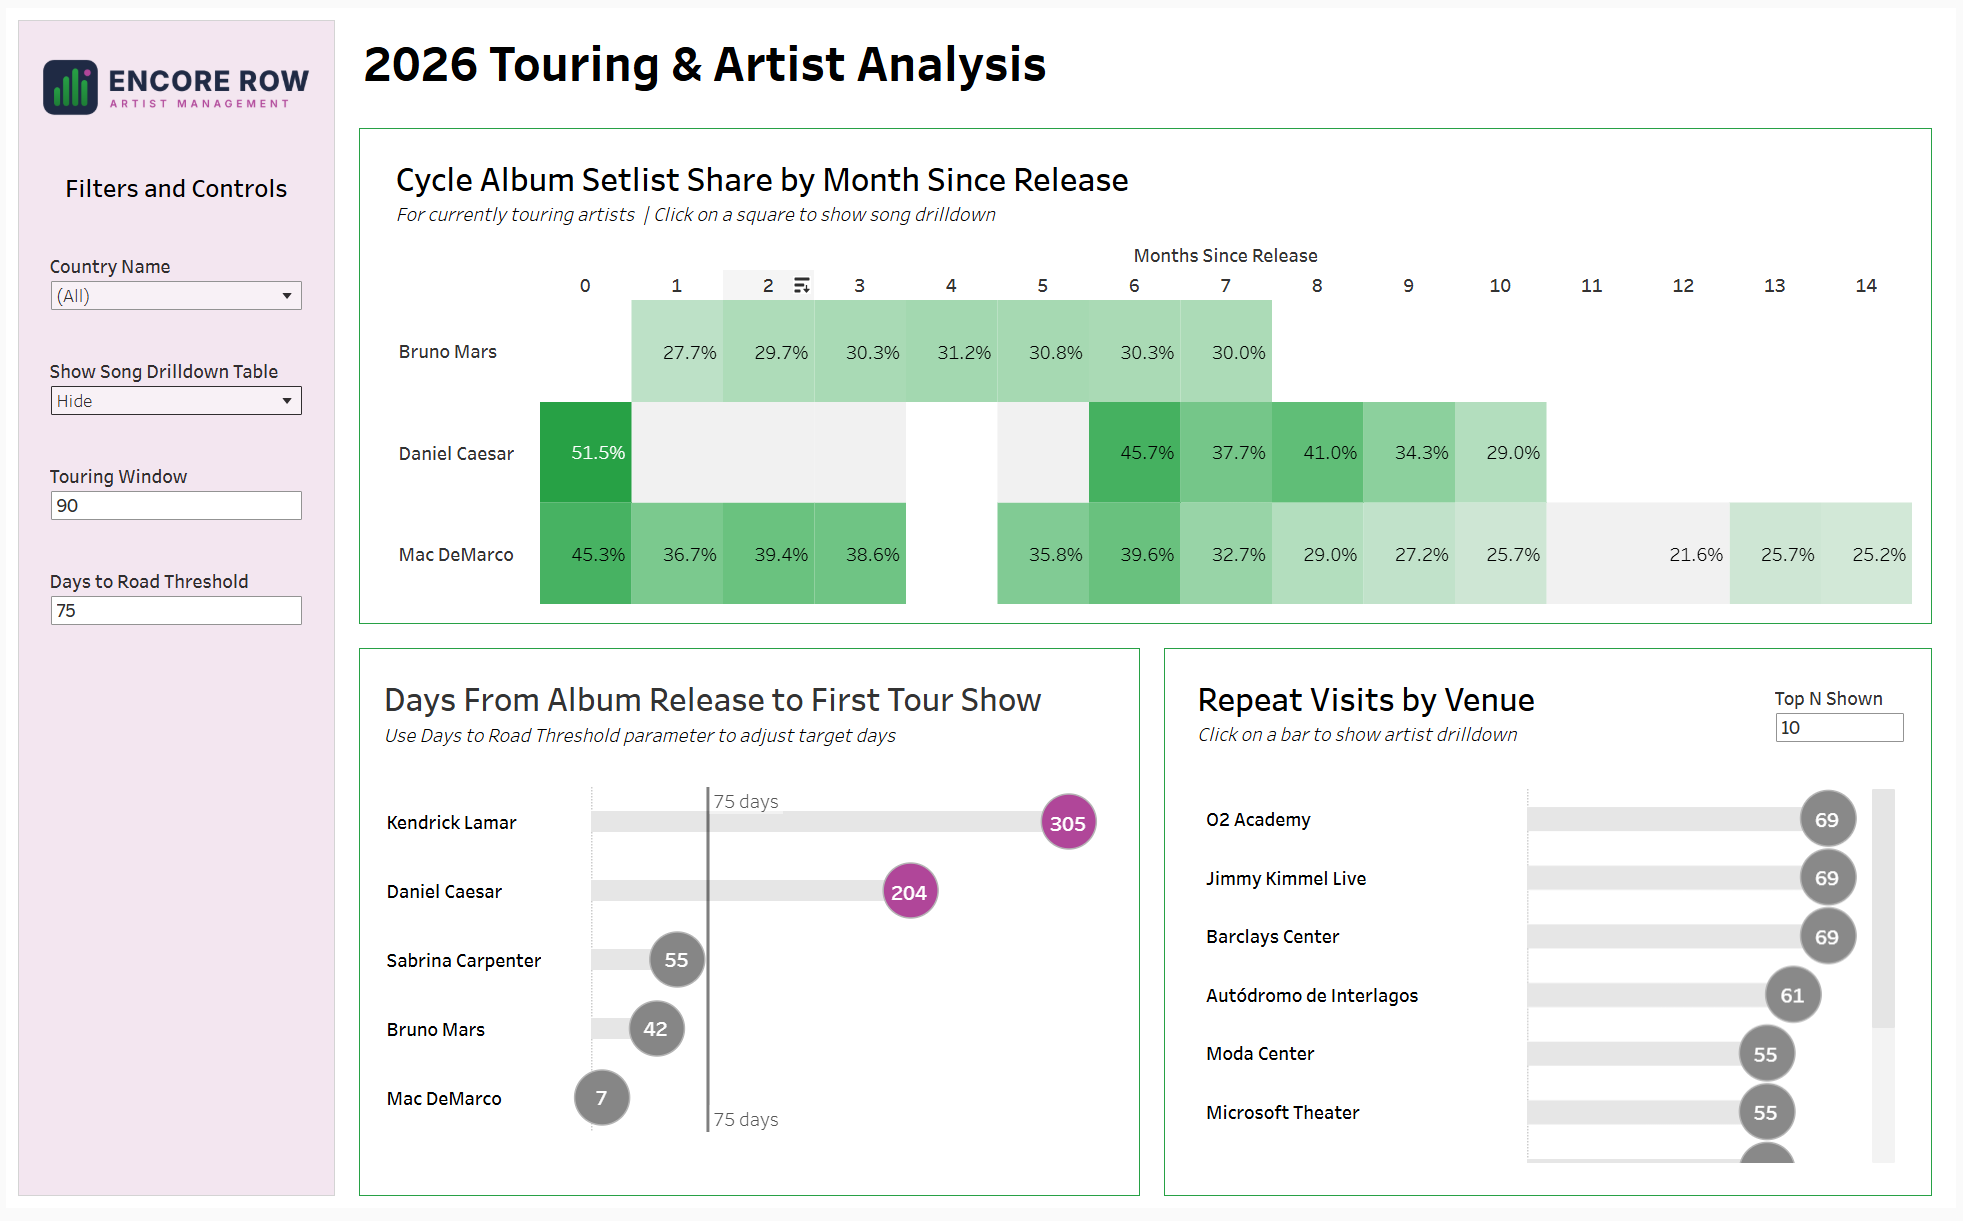
Otherwise, with the rest of the view I made sure green was positive (if an artist was on tour), and purple was negative (Sabrina Carpenter had an cycle album share less than 30%).
Analyst View
I did not have a finished view for the analyst dashboard yesterday, but I ended up scrapping the 4th chart and kept it to 3 charts visible. But, it goes to 4 with a DZV detail table that opens up once you click on a square within the heatmap. Here's my final view:
Heatmap
First up, the heatmap shows for each artist currently touring and months since the release of their new album, what percent of songs from setlists in that month are from that new album (aka Cycle Album Share)? We could expect to see that percentage fade as months since release of that album goes on, but we would want to see that percent stay at about 30-40% during that album's tour. So, an analyst could click on a square in the map to see what songs were played in that month, and how many shows they were played at to potentially push songs for a single. Here's the interactivity:
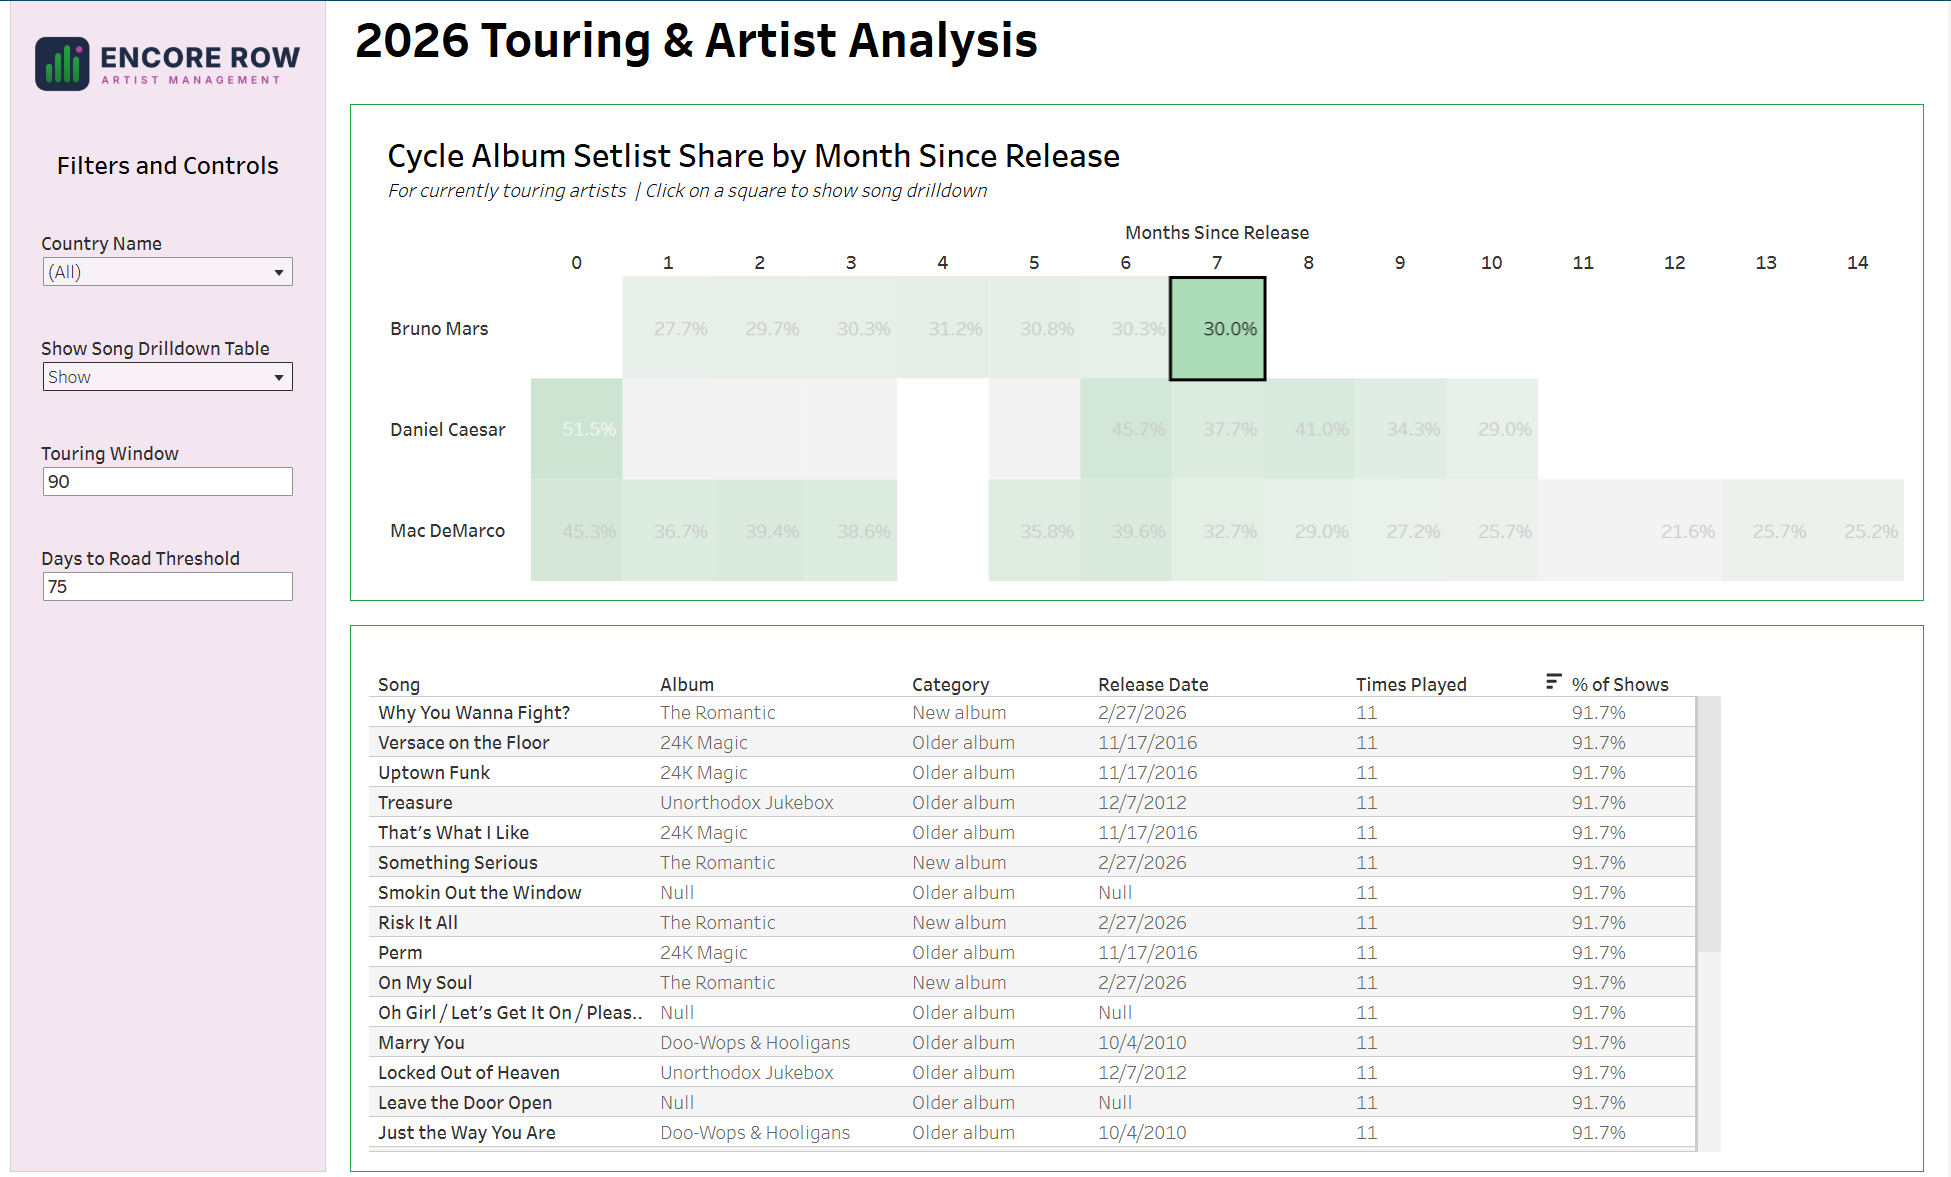
An analyst can also show this table to view all songs at once by selecting the 'Show Song Drilldown Table' button in the filters and controls pane.
Days to Road Chart
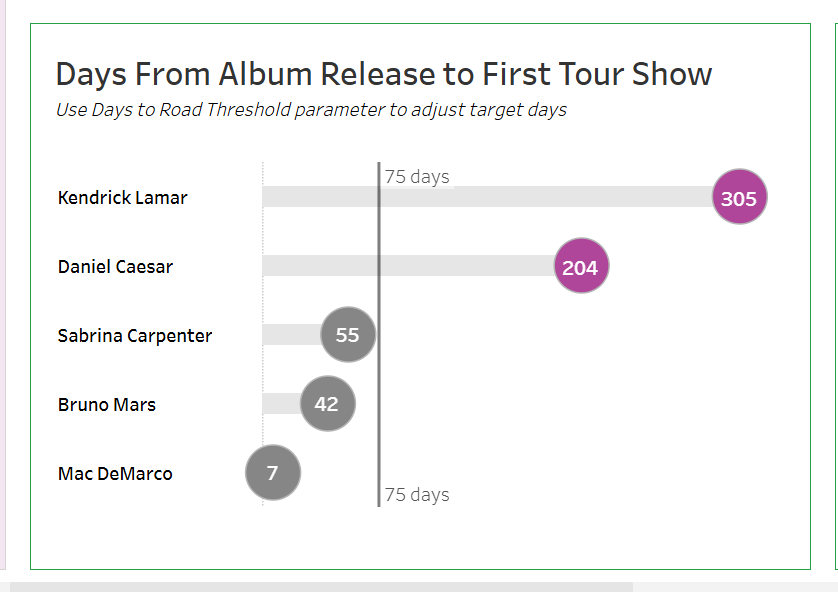
In this chart, I updated it to have a threshold which could be adjusted. If an artist takes more days than the threshold to go on tour after an album release, they are flagged in purple. Managers would then want to ensure that these artists have tour dates lined up early in this album's cycle to not allow this amount of lead time.
Repeat Visits by Venue Chart
The last chart shows repeat visits by venue, and allows a top N parameter to show however many venues an analyst would like. I also added a set action interaction to let the user see an artist breakdown of that venue by clicking on a bar. Here's that interactivity:
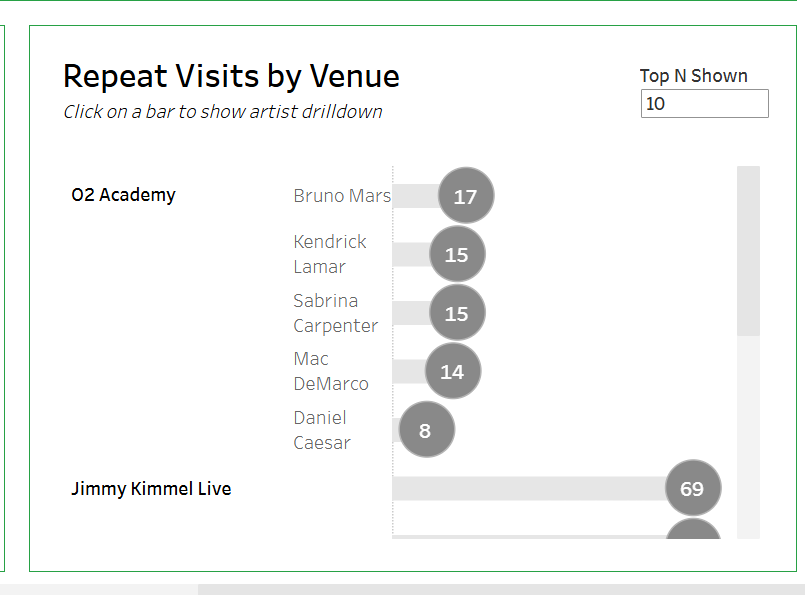
Now we can see the visits are mostly evenly distributed besides Daniel Caesar. So, an analyst can make sure they maintain that venue relationship and continue booking artists with 02 Academy. They can even propose a firm-wide package deal to get all artists in there to help Daniel Caesar get more events booked as well.
Final Thoughts
And that's my dashboards. I had a good time with this project, it was fun to explore data in a topic I'm passionate about. I ran into some challenges of course, like with 503 or 429 errors when pulling API data or with chart generation, but this was great experience learning to build a realistic end-to-end data pipeline.