


In this blog we are going to be looking at calculating a moving average using the Multi-Row Formula.
Step 1.
Understand your data. In the example below, each row represents a quarter and we want to understand how the average in changing over time.
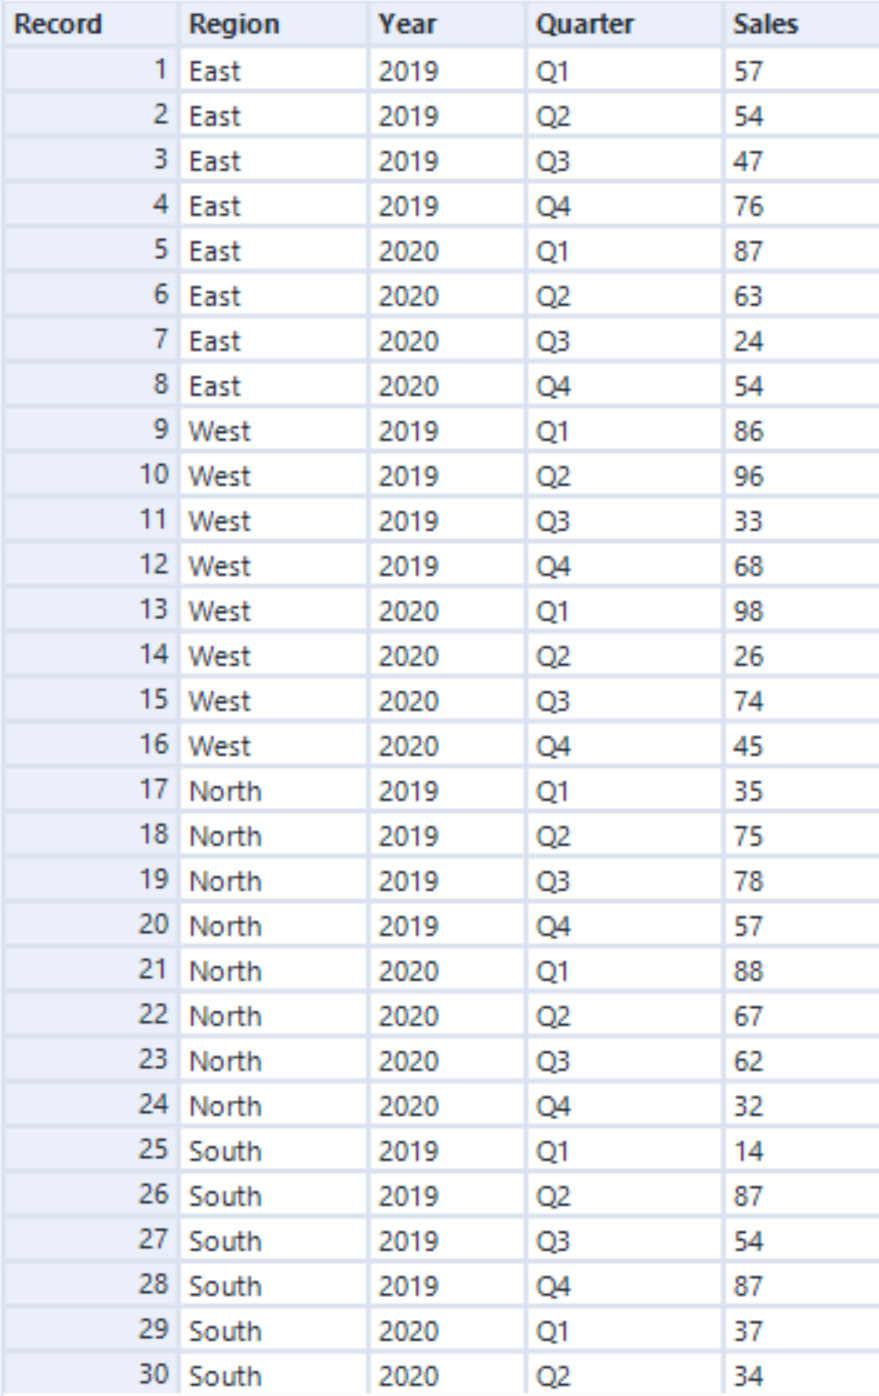
Step 2: Choose the correct tool. For this data the 'Quarter' field in a row, so we are going to use the Multi-Row Formula Tool.
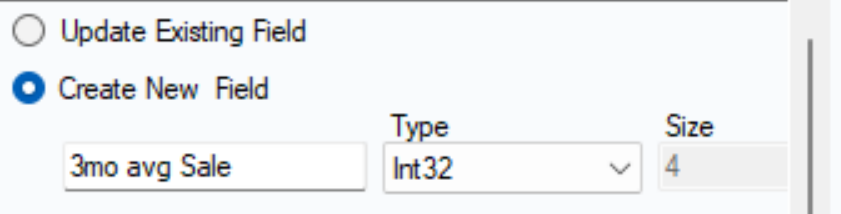
Step 3: Select Create New Field and name your new column. Here I have called in 3mo avg Sale.
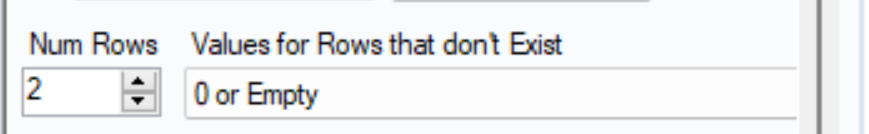
Step 4: Increase number of rows, for this data we are looking at a 3/4 moving average so we need to increase the Num Rows to 2.
Step 4: Group by. Here we are going to Group by Region. Next, write an expression. ([Sales]+[Row-1:Sales]+[Row-2:Sales])/3.
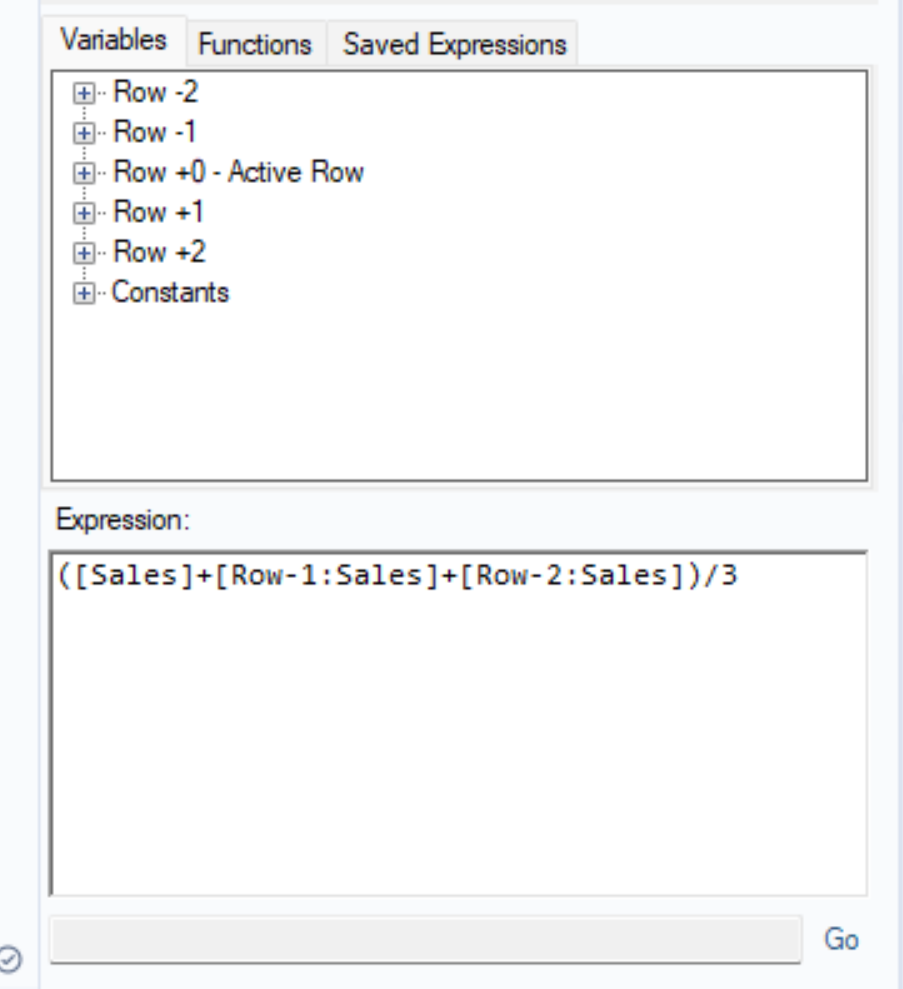
This expression is basically saying, sum the current row sales, with the row before and the row before that, then divide by 3 because we are trying the 3/4 moving average.
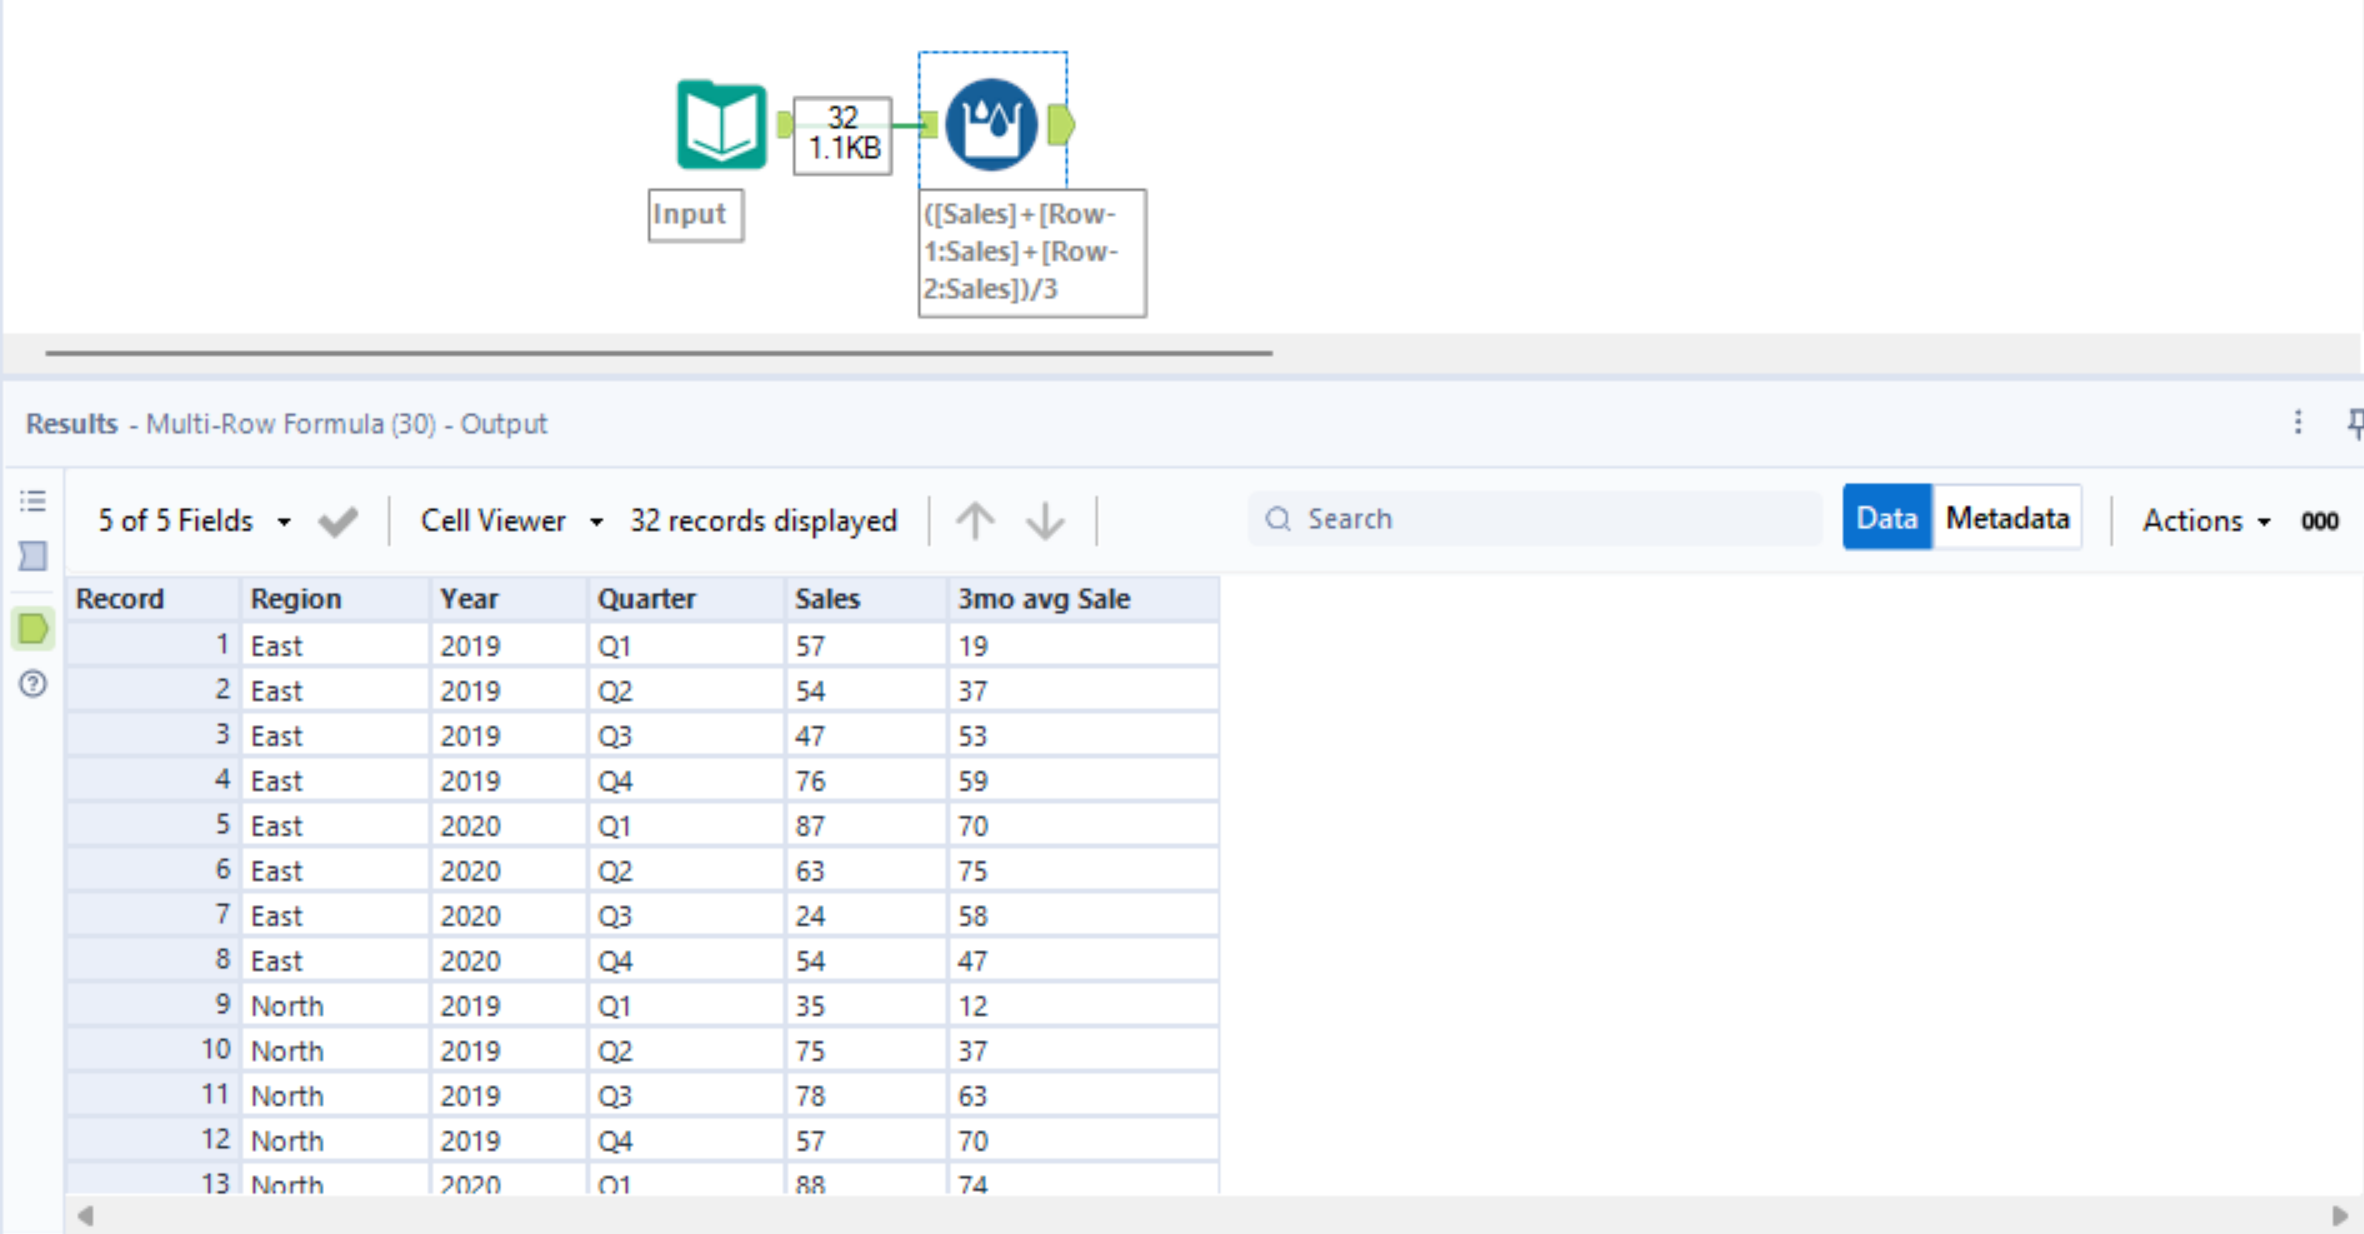
Output:
And that is it, you have calculated a moving average.