


After 17 weeks of training, we finally reached our capstone project, where we were tasked with bringing together everything we had learnt to build an end-to-end data pipeline, from extracting data through an API to transforming it in Alteryx, modelling it in Snowflake, and finally building two Tableau dashboards for different stakeholders.
I decided to focus my project on the music industry, specifically understanding what makes a song successful on Spotify and Billboard charts between 2017 and 2021. Rather than simply looking at the most popular songs or artists, I wanted to investigate the characteristics behind their success, from the genres and labels dominating the charts to the tempo, musical keys, chord progressions, and audio features of those songs.
However, getting to the final dashboards was not nearly as straightforward as I had initially anticipated.
The Challenges: From API Integration to Data Modelling
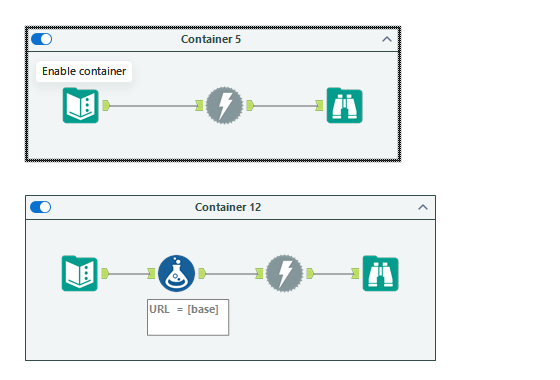
One of my biggest challenges came right at the beginning: extracting data from the Spotify API.
Configuring the authentication process in Alteryx took considerably longer than expected. Between 400 Bad Request errors, 401 Unauthorized responses, expired tokens, and quota limitations (what I like to call the four horsemen of APIs) there were plenty of occasions when I questioned whether I would be able to retrieve the data I needed.
What made this particularly frustrating was discovering that some of the documentation and tutorials I had been following were outdated. Spotify had introduced restrictions to its Web API earlier this year, limiting access to some of the audio features I had originally planned to extract.
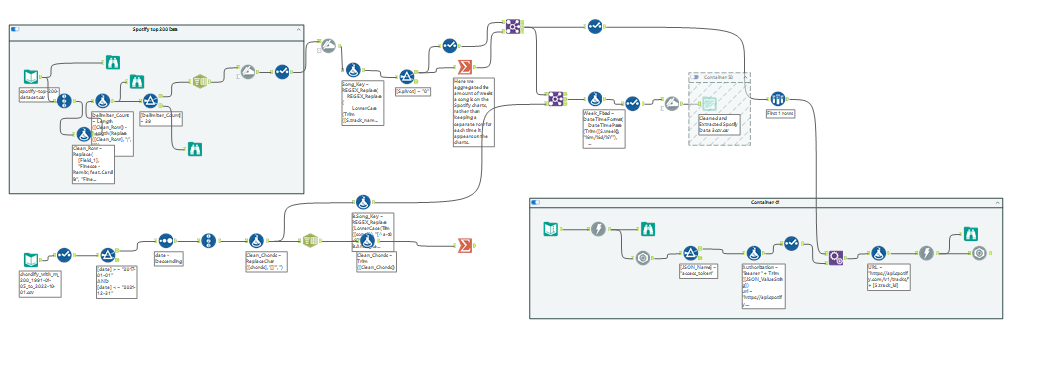
This meant reconsidering my approach. Rather than relying entirely on Spotify's API, I used historical Spotify and Billboard datasets alongside alternative sources such as Reccobeats, chord data (from Chordify) and github datasets. The Spotify API became more useful for validating song metadata, including artist names, albums, track IDs, and duration.
Once I had settled on my datasets, the next challenge was ensuring they could be joined accurately.
Spotify and Billboard measure commercial success differently, and their datasets didn't always use consistent song or artist names. Initially, joining on song titles alone caused incorrect matches. For example, Love by Lana Del Rey could be matched with LOVE. by Kendrick Lamar, despite being completely different songs.
To resolve this, I created standardized song and artist keys, allowing me to match records using both the song title and primary artist. Other cleaning challenges included delimiters appearing within song titles, inconsistent formatting, missing data, and multiple versions of the same release.
The next issue came when building the Snowflake schema. Because songs can have multiple artists, genres, and chord occurrences, joining everything into one large table risked duplicating records and inflating measures. Introducing bridge tables, separating facts and dimensions, and creating reusable SQL views helped preserve the relationships between the datasets.
Although these challenges took a considerable amount of time, they ultimately reinforced how important data integrity is.
Dashboard 1: Executive Overview.
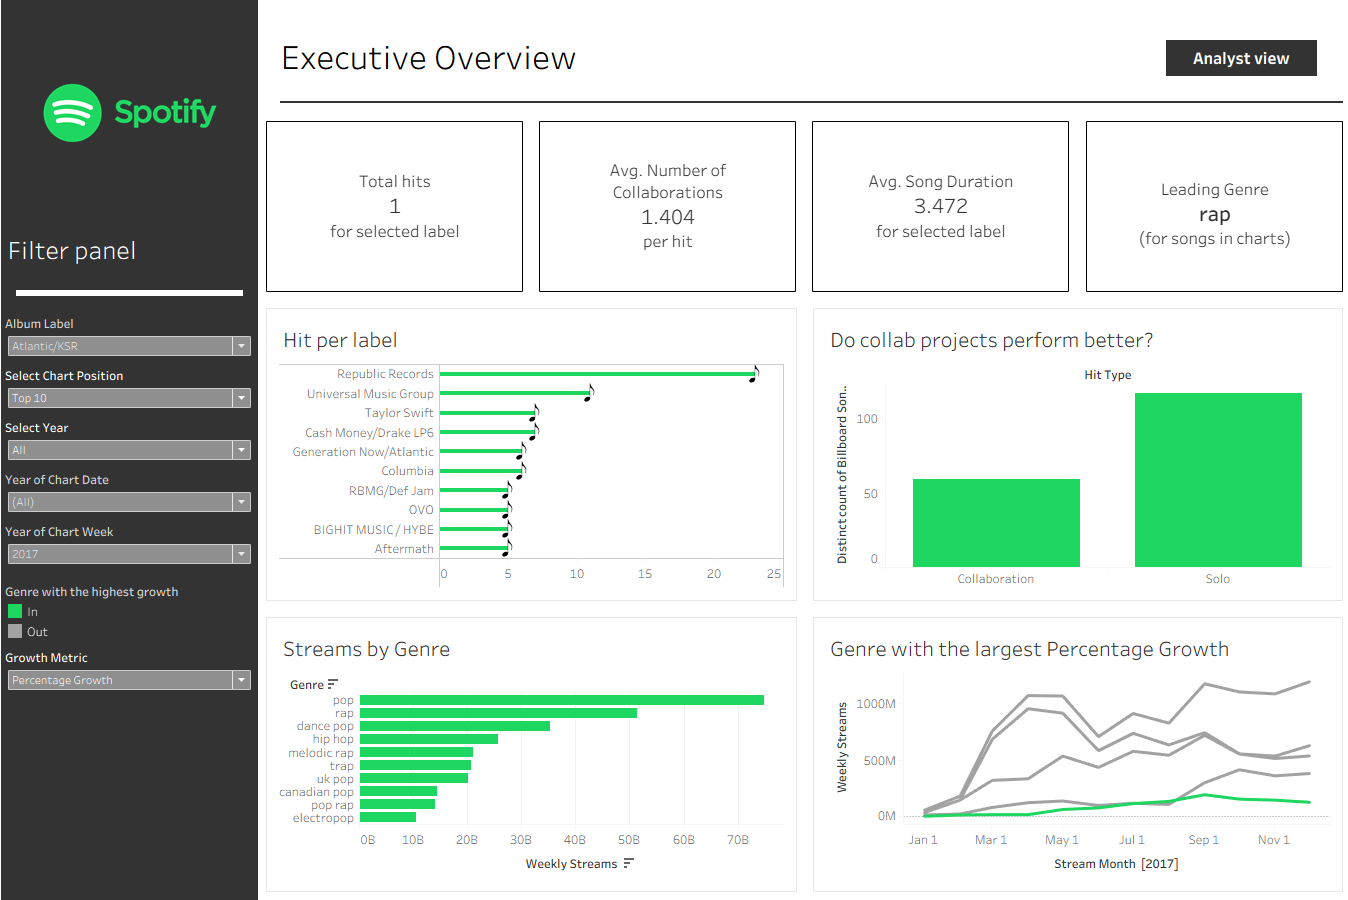
The first user story focuses on a record label executive wanting to understand how their competitors are performing and where the greatest opportunities might be.
I wanted the Executive Dashboard to communicate its insights quickly, which meant prioritizing simple charts, clear KPIs, and minimal interaction.
The dashboard allows executives to identify which competitor record labels are producing the most Billboard hits, with the option to change what constitutes a hit, whether that's a number-one song, Top 10, Top 20, or another chart-position range.
The KPIs provide a quick overview of the number of hits, average number of artists per song, average song duration, and leading genre within the selected data.
Another question I wanted to explore was whether collaborations were more common among successful songs than solo releases. The collaboration chart allows the executive to compare the number of hits across these two categories.
However, understanding the industry goes beyond just Billboard positions.
The bottom two charts focus on Spotify streaming performance. The first identifies which genres generate the most streams, while the second explores the five fastest-growing genres, allowing the executive to switch between absolute growth and percentage growth across the selected year.
Together, these charts allow executives to understand the competitive landscape, identify growing genres, and decide which areas warrant further investigation.
But what happens when an executive identifies a genre they want to invest in?
Dashboard 2: Analyst Overview answering what Goes Into Making a Hit?
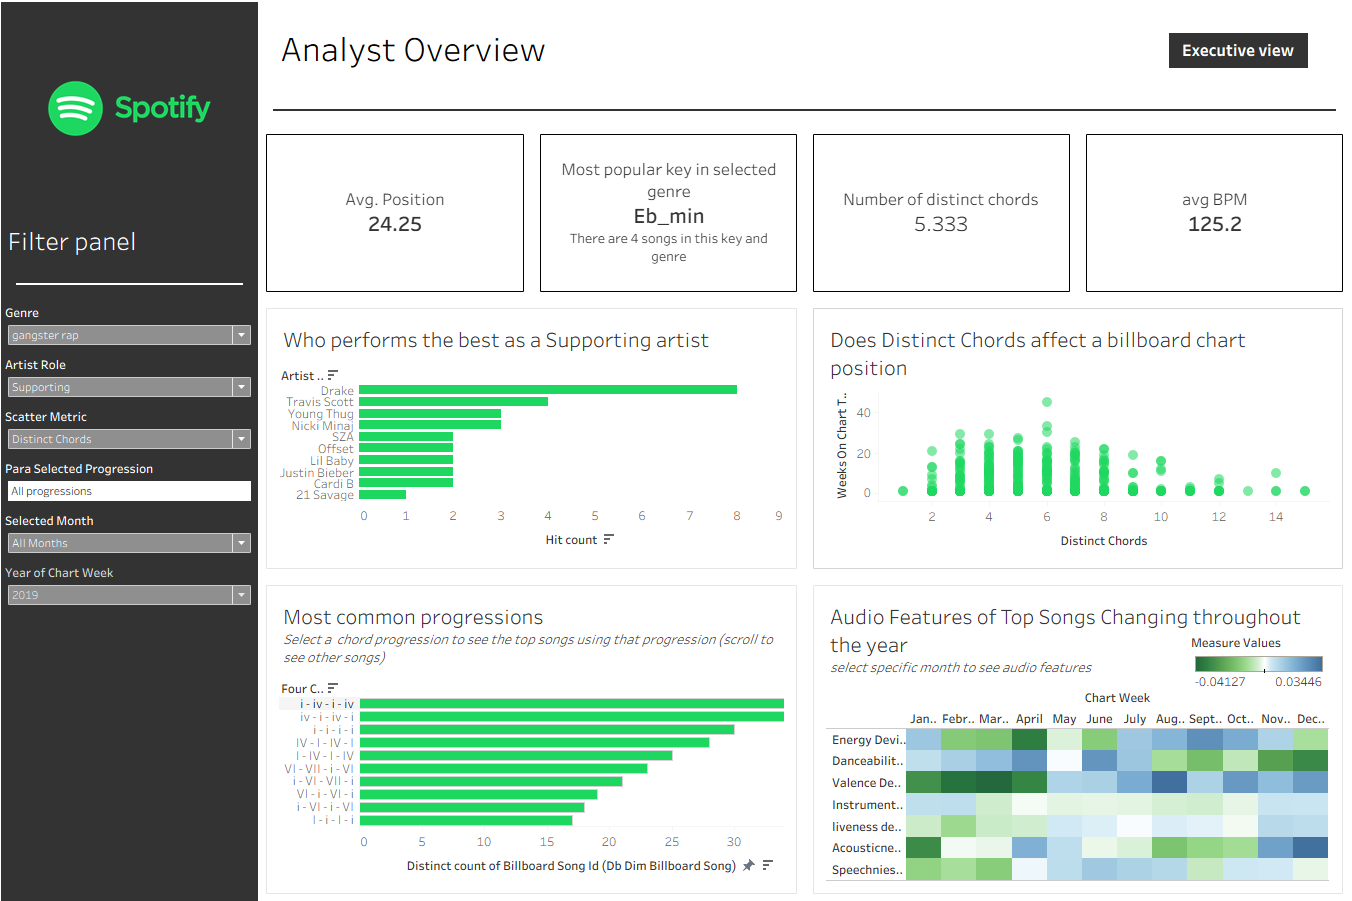
The Analyst Dashboard builds on the Executive Overview, but rather than simply understanding which genres and labels are performing well, the analyst can investigate the characteristics of successful songs within a particular genre.
Example: Imagine the executive has identified a growing genre from the initial view and wants the analyst to explore what a potential release in that genre might look like.
The analyst starts by selecting the genre and examining the four KPIs. These show the average Billboard chart position, the most common musical key, the average number of distinct chords used, and the average tempo in BPM all in the selected genre.
These metrics provide an initial understanding of the musical characteristics associated with successful songs in that genre.
From there, the analyst might want to understand which artists they should consider working with.
The first chart ranks the Top 10 most successful artists, with a parameter allowing the user to switch between primary and supporting artists. This becomes particularly useful when considering whether bringing a featured artist onto a track might be worthwhile.
The second chart explores relationships between commercial performance and other song or artist characteristics. Through a measure case switch, the analyst can investigate factors such as song duration, artist follower counts, and the number of distinct chords, comparing them with chart performance or longevity.
Of course, these relationships don't necessarily imply causation, but they can provide interesting starting points for further analysis.
Once the analyst has an idea of the genre, artist, tempo, and musical key, the next question becomes: what might the song actually sound like?
This was one of the more interesting parts of the project for me.
The bottom-left chart displays the 10 most common four-chord progressions among songs in the selected data. Using Roman numerals rather than just chord names allows the analyst to explore recurring musical structures across different keys.
I also implemented a parameter action and Dynamic Zone Visibility, allowing the user to select a progression and drill down into the individual songs that contain it. This gives the analyst real examples they could listen to for inspiration.
Finally, I wanted to explore when a song with particular audio characteristics might be better suited for release.
The audio-feature heatmap examines how characteristics such as danceability, energy, valence, acousticness, and speechiness vary throughout the selected year.
Rather than simply showing average values, I used Tableau window calculations to calculate each month's deviation from its baseline average. This makes it easier to identify months where particular audio characteristics were more or less prominent than usual.
Selecting a month reveals a radar chart showing the actual average audio-feature values for that period, allowing the analyst to explore the patterns in greater detail.
While these patterns can't independently determine the optimal release date, they offer another perspective on the types of songs appearing in the charts at different times of the year.
Ultimately, the Analyst Dashboard was designed to take the user through a logical process: understand the genre, identify potential collaborators, explore successful song characteristics, investigate musical structures, and consider release timing.
Final Thoughts
The purpose of this dashboard suite was to inform a music label on how they're competitors are performing, how they can build out a song, and ultimately what comprises of a billboard and Spotify top charts songs.
While I don't believe in making music formulaic at all, this was a particularly fun project because it allowed me to combine my interest in music with data analytics during a period of considerable change in the music industry, between 2017 and 2021.
Interestingly, I went into the project expecting shorter, more easily shareable songs to dominate the charts, particularly with the growing influence of social media. However, my analysis didn't reveal the clear relationship I had anticipated.
Overall, I'm happy with how the dashboards came together. Both serve their intended stakeholders: the executive can quickly understand the competitive landscape, while the analyst can investigate the musical and commercial characteristics behind successful songs.
More importantly, this capstone demonstrated how much of data analytics happens before a dashboard is ever built, and how decisions made throughout the pipeline ultimately determine the quality of the final insights.
Explore the dashboards here: Music Analytics Capstone — Tableau Public
Capstone technical skills and tools used
- Alteryx: API integration, JSON parsing, data cleaning, transformations, and joins.
- Snowflake / SQL: DDL, DML, staging tables, dimensional modelling, bridge tables, analytical views, window functions, and data validation.
- Tableau: Parameters, parameter actions, dashboard filter actions, Dynamic Zone Visibility, Level of Detail (LOD) expressions, context filters, table calculations, window calculations , dynamic measure selection, Top N filtering, extensions.