


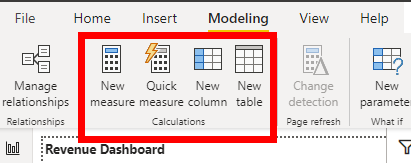
There are 4. different ways to do:
1.new measure
2.quick measure
3.new column
4.New Table
I would like to refer to the first three today. When I have understood No. 4 better I will add this in the future.
1.new measure:
Here the Dax expression is used to create a new measure. This expression looks like this.
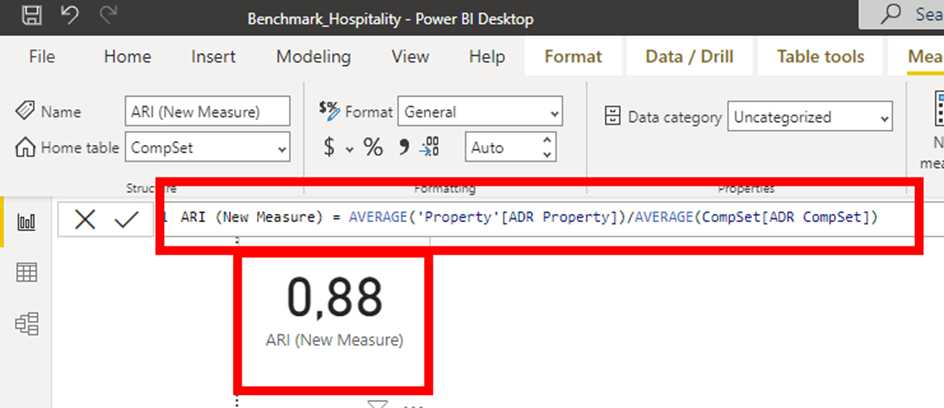
Syntax: column name = aggregation('Table'[Field]) "calculation" aggregation('Table'[Field])
!!! New Measures do not create new columns in the dataset, they only exist in the Data Pane !!!!
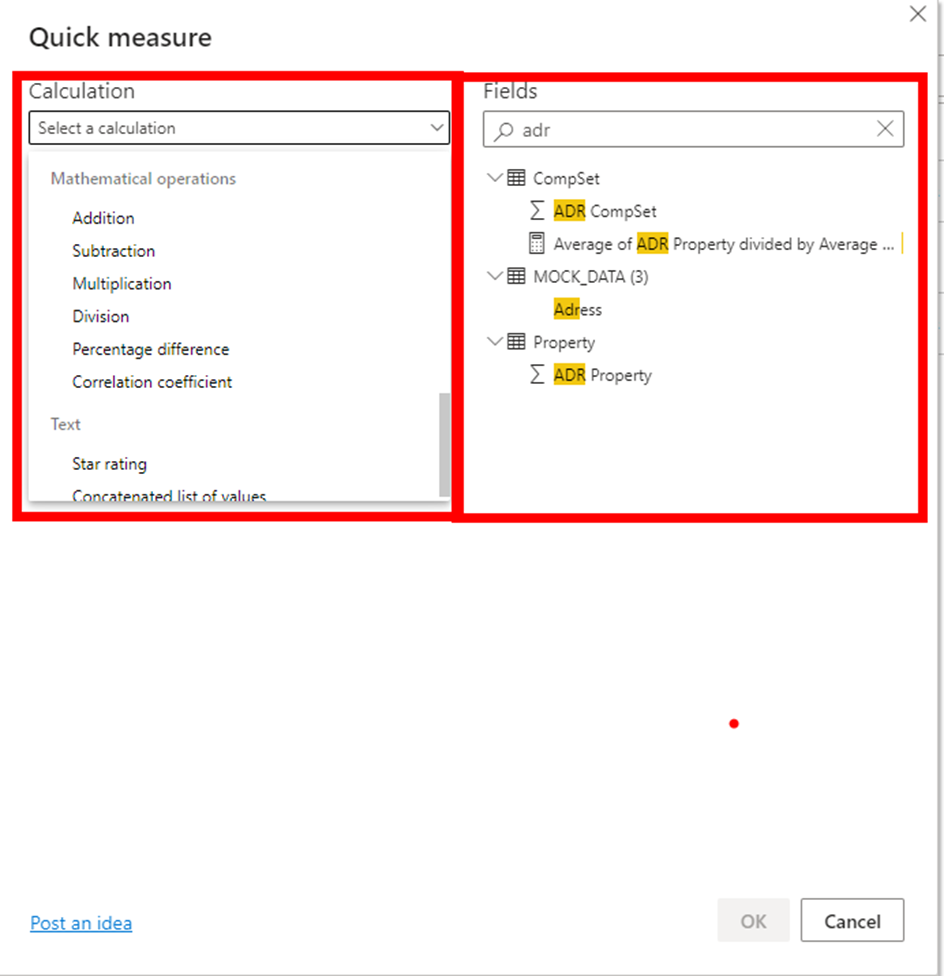
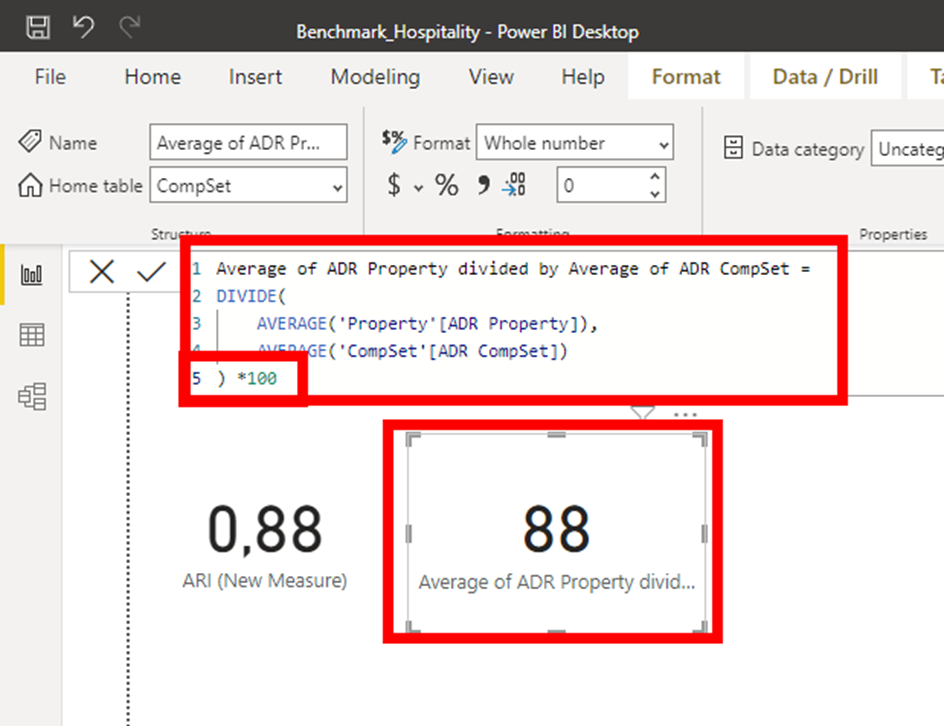
2.quick measure:
In this case the user is helped a bit and the syntax is offered by simply selecting the calculation, aggregation of the measures on the left side and the fields on the right side via dropdown.
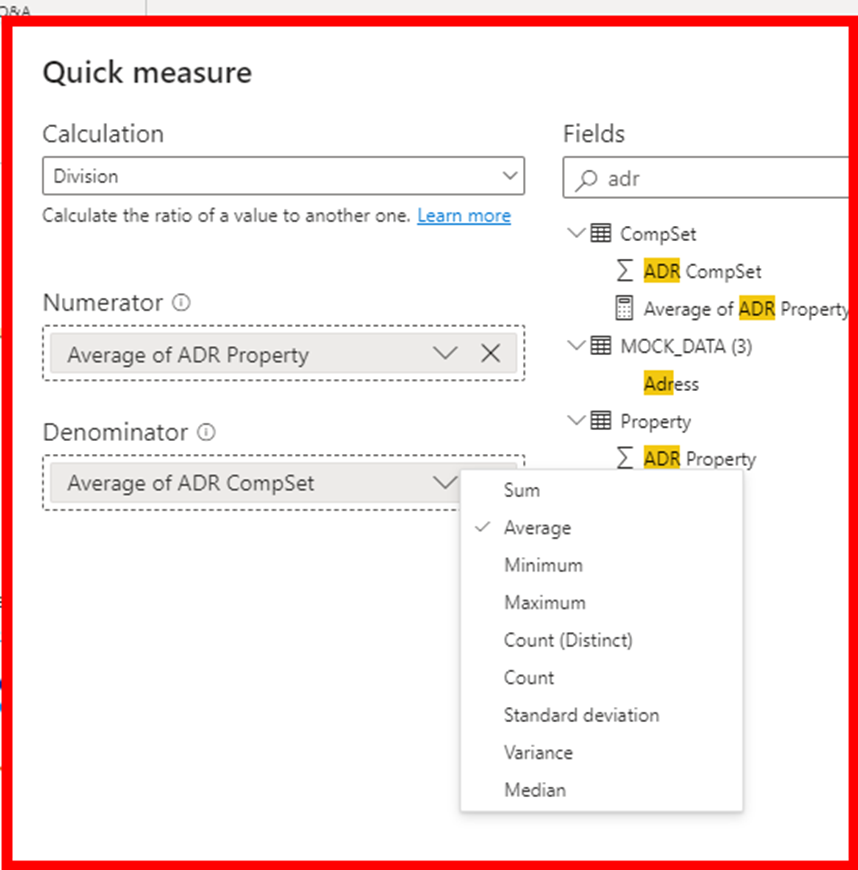
The resulting syntax looks a bit different in this case but does exactly the same. Besides the simplification of the syntax there are also two disadvantages. The first disadvantage is that the Quick measure method does not take decimal places into account. To clarify the result in this case I added a '*100' to the resulting formula. The second disadvantage is that you have to rename the new measure in an extra step.
!!! Quick Measures do not create new columns in the dataset, they only excite in the datapane!!!
3.new colums
With this method we also use the Dax syntax of method number 1 and in this case really create a new column in the dataset. This new column can be added to any existing dataset.
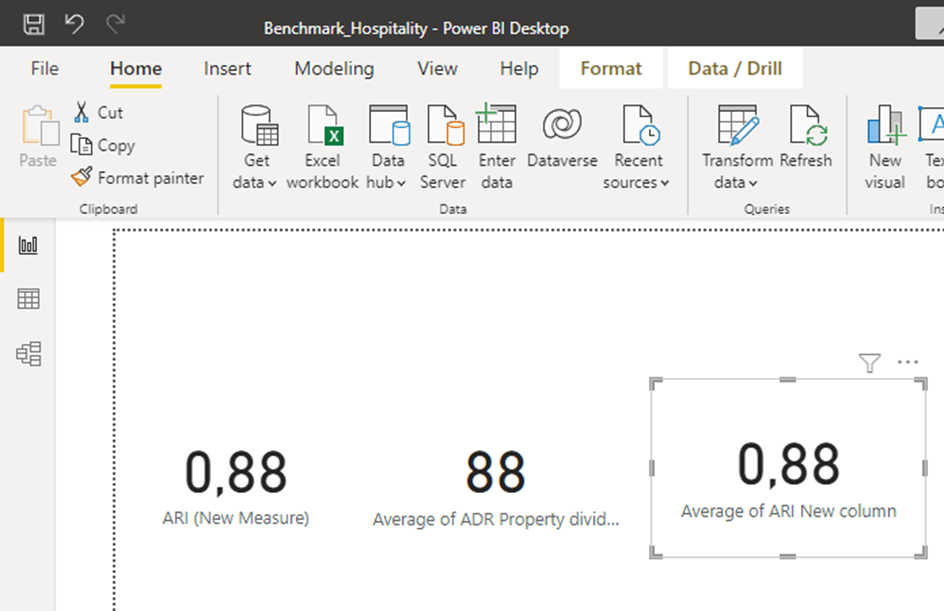
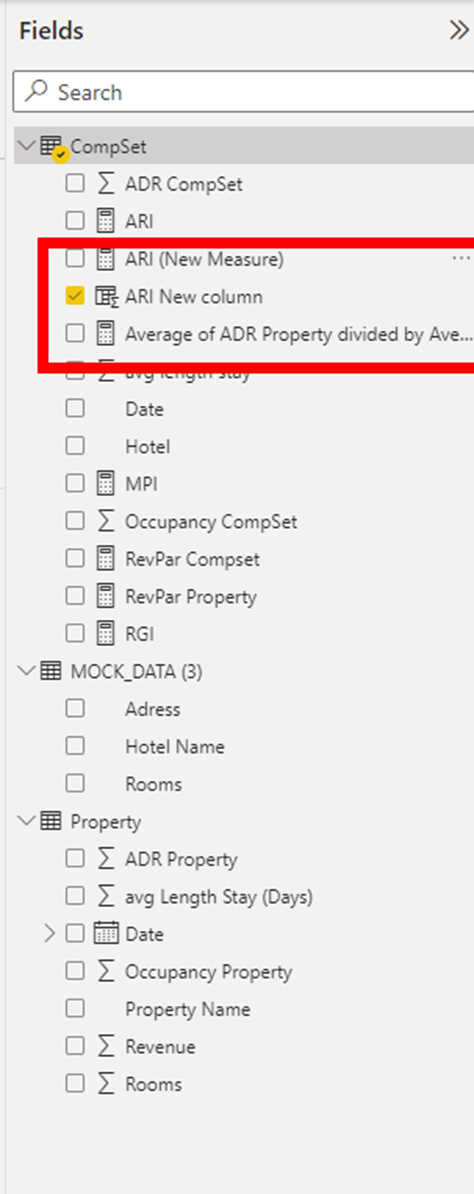
In the datapane you can see this by the symbols above.
Conclusion: Quick measures are suitable for quick short-term calculations.
New measures are more advanced and can be used for more complex formulas. And New columns can also be made more complex and add a new column to the selected dataset which can later be used in further visualizations.