5 topics, 5 dashboards, 5 days.
Day 2 was all about templates. Having templates in your back pocket can be super useful when you are working on tight deadlines, require inspiration or when you're asked to showcase examples. They save you time and ultimately money and/or stress.
Brief: Design and create two templates across two different software's: Tableau & PowerBI, e.g. one template for each software.
Tableau: Sales Dashboard
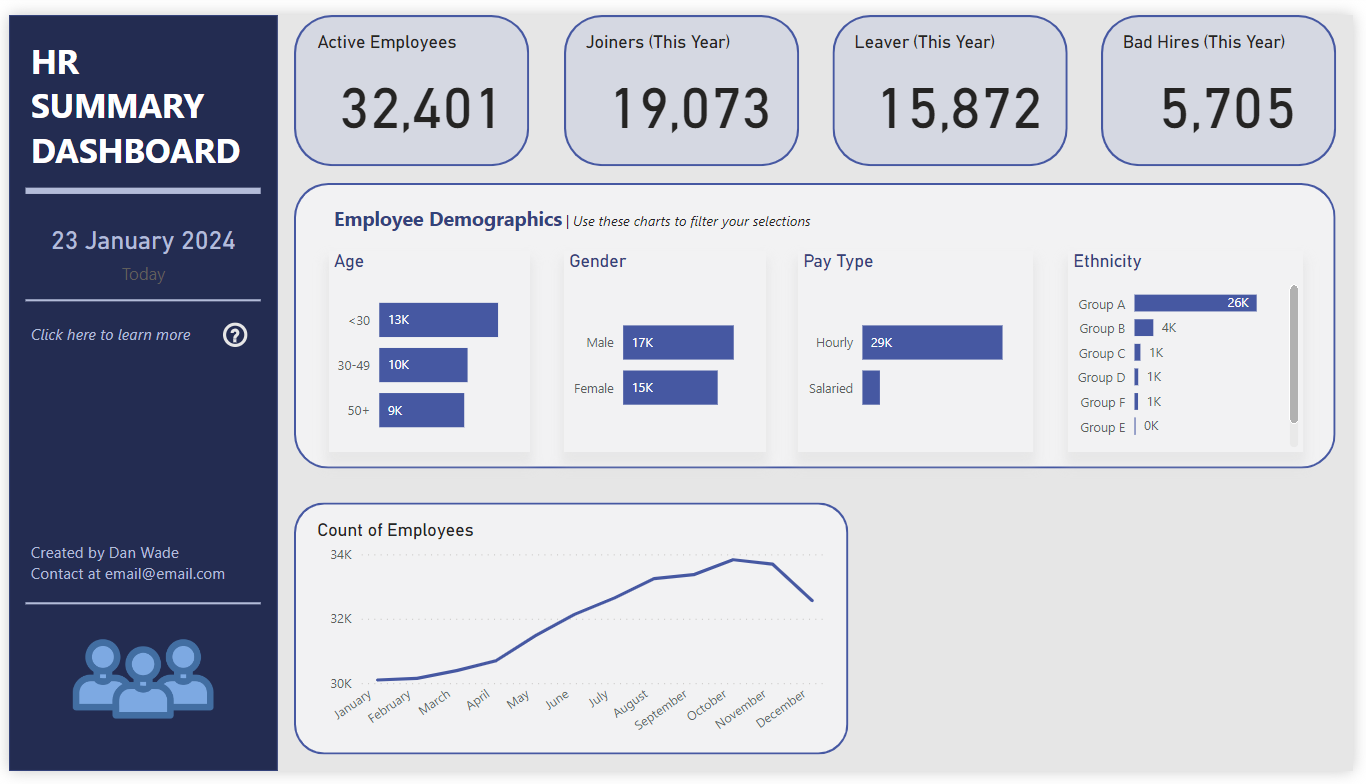
Power BI: HR Dashboard
The plan for the day:
- Research templates and examples of Tableau Public/Pinterest
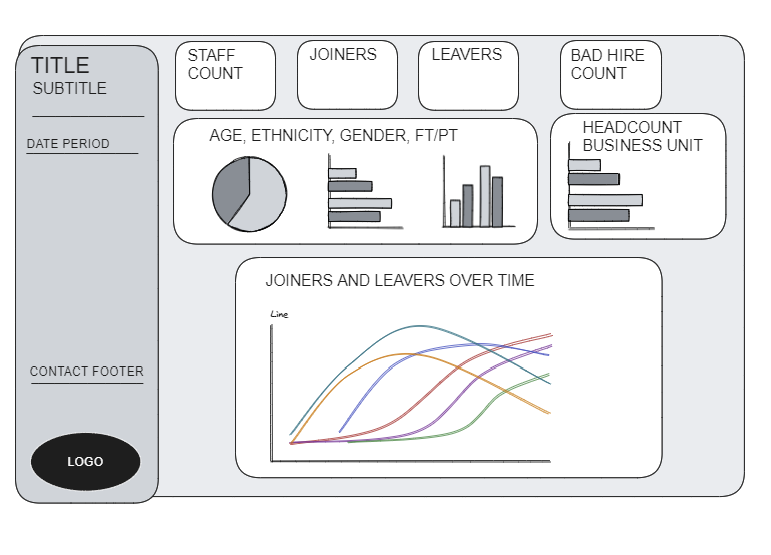
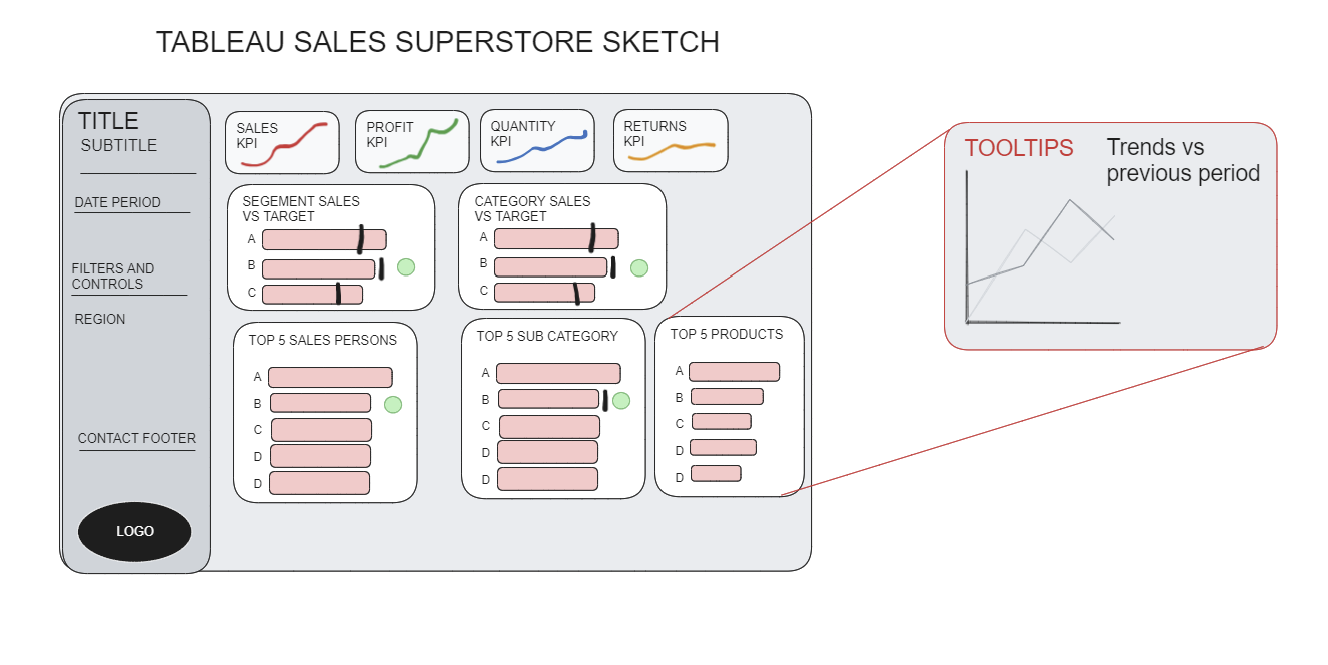
- Sketch out designs in Excalidraw
- Build First Draft of both dashboards
- Feedback and and tweaks
- Present
Sketches
PowerBI - HR

Tableau - Superstore Sales

Dashboards
PowerBI - HR

Tableau - Superstore Sales

Reflections
- Creating two dashboards in 5 hours is very difficult
- Knowing how to focus your efforts depends on how well you know the data
- For the HR data I was less sure of the direction and spent more time trying to understand the fields before I could dive into the analysis
- With Superstore, i've worked with this many times and so I knew the direction I wanted to go in
- I allocated more time to the Power BI but didn't get as far
- I allocated the first half of the day to building out the templates layouts so that depending on how much progress I made, I'd be able to present the proof of concept. This worked in my favor for Tableau, where I ran out of time to build two of the charts, but the placeholders show the proof of concept well.
Tableau Public Link:
https://public.tableau.com/app/profile/vizgrowth/viz/SuperStore-DashboardWeekDay2/Dashboard
Power BI Link:
