


5 topics, 5 dashboards, 5 days.
Day 3 was all about SQL and extracting data from a very large database before preparing it for analysis in Tableau.
Brief: You'll be investigating a fraction of the imaginary company called, MoVer, who manages, sells and distributes products. It is a large retail company who has multiple stores located nation-wide and also sells products through catalogues and the internet.
Requirements for today:
- use Snowflake worksheets to interrogate the data and prepare your SQL queries
- DB (SNOWFLAKE_SAMPLE_DATA) SCHEMA (TPCDS_SF100TCL)
- Use LIMIT to prevent the query of billions of rows until it's necessary!
- Use the New Custom SQL function underneath the tables in Tableau after connecting to the database schema to create your table(s)
- Relate multiple tables (or pre-join them in the queries) where you see fit
- Build out your insights using a combination of sheets and dashboards, put together into story pages (yes the 'new story' icon on the bottom middle of tableau desktop.
The plan for the day:
- Interrogate the database
- Scope out a business element to investigate
- Plan the data transformation
- Sketch the dashboard and sheets
- Execute the queries
- build dashboard
- Reflection / notes
This dataset contains 23 tables of mock data with billions of rows. The first point of call was to generate a user story to narrow down the scope of the project.
The user story I landed on was:
As a... finance team
When I am... evaluating the costs to the businesses through returns
I want to... understand which products, warehouse and carrier is responsible
So that I.... can reduce costs and improve processes
Further to this, I only wanted to explore two reason for return; "Package was damaged" and "Not the product that was ordered". These reasons were mostly relevant to Web orders and Catalog orders so I excluded store orders from my scope.
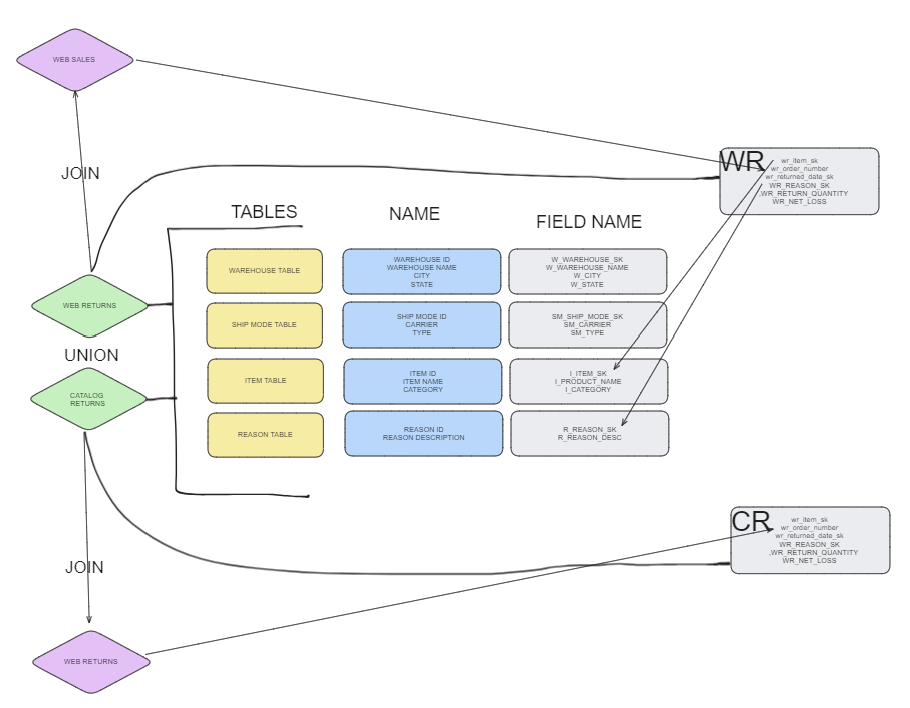
SQL Extract Sketch
My first sketch was aimed at planning out which fields I needed and what joins were required. I identified all the tables I needed, along with the field and the exact field names. Then I mapped out which primary and foreign keys I would need to join the data on. These steps were identical for both web returns and catalog returns, so the intention was to then union the tables of data together.
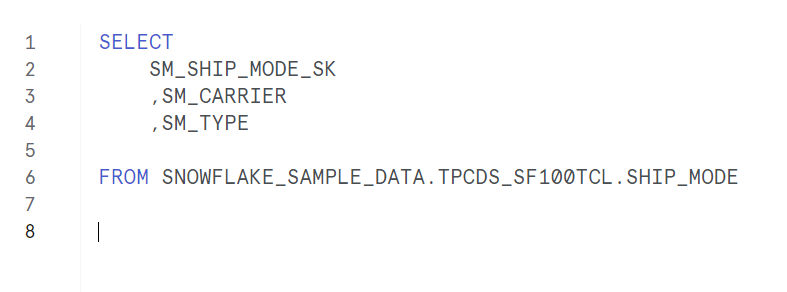
Queries
First, I built the queries for each individual table so that I could copy and paste the fields across to my main query. This was a simple select statement such as:
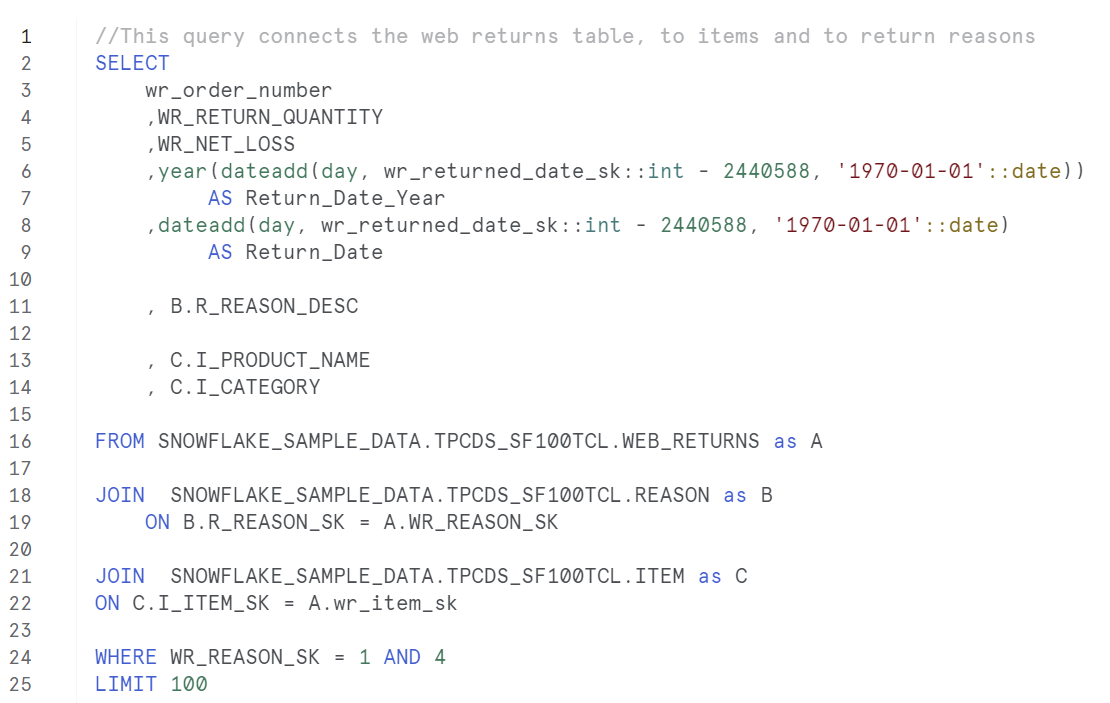
Our first challenge we came across as a group was with our date fields that came in the very useful format of Gregorian which required a conversion to a useable date. Next, I joined my web-returns table with my reasons and items table. Limiting this to 100 records to get sample of the data.
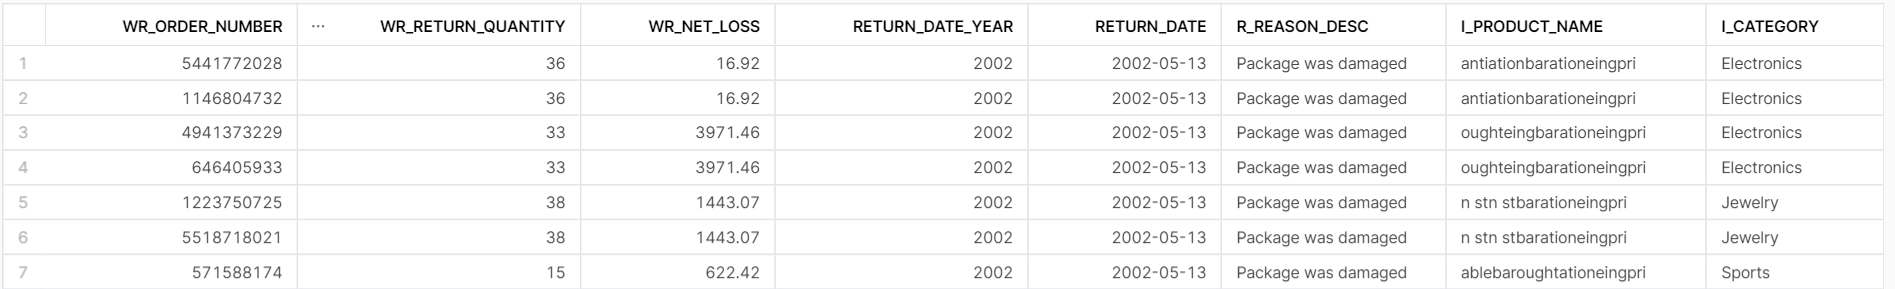
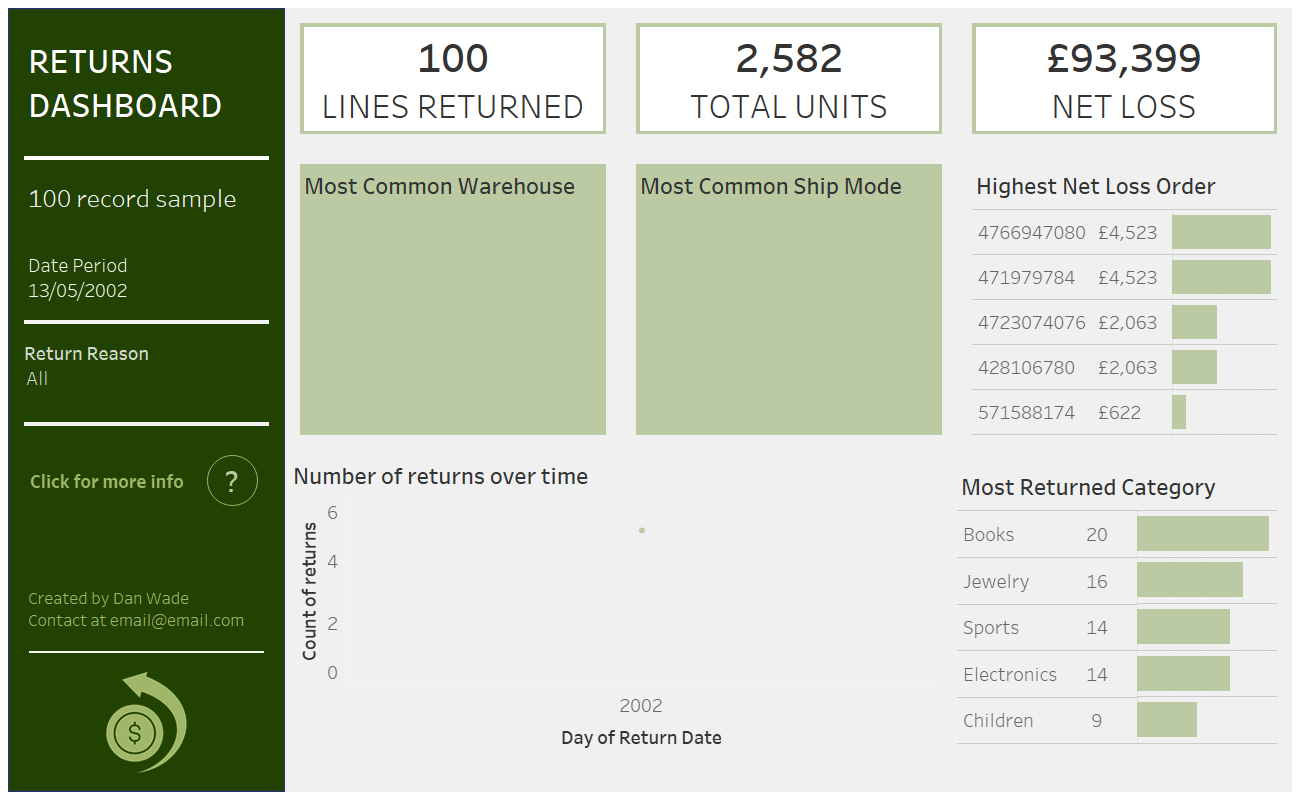
The problems began when trying to join to the web-sales table. Across the group we all had some trouble gathering our data and had to put limits on the number of returns in order for our queries to execute. I ran a query over lunch which lasted 58 minutes before timing out. Therefore I had to take my sample of 100 rows and began building out charts and a dashboard as proof of concept.
The limitation here was that I had missing fields. My records were limited to a single day, to a single reason for return and no data for warehouses or ship date like I intended.
Dashboard and charts
Below is the dashboard I produced. With placeholders to show the outstanding pieces of work. Next steps would be to union the web-returns data and catalog returns data. Increase the range of dates that the data contains. Currently its isolated to a single day. Finally to remove the limit on the number of rows to obtain a larger final dataset.
Reflections
- This is the first time working with a HUGE dataset and probably wont be the last
- My method to writing queries is to write them out in steps. Writing, executing, and writing more like as I go. These steps help me built out a query logically. This works fine on a small dataset but not so well on a larger dataset that takes longer to execute for each step
- I've found my groove with writing tidy and readable queries which helps me interpret and troubleshoot my work
- Data gathering is tricky, Dashboard building is fun