


In this blog, learn how to build a parameter to switch between different date periods.
What is a parameter date switch?
A parameter date switch allows your dashboard user to easily switch between different date formats within the same view of chart. This is an alterative to using the +/- buttons on the axis which are not user friendly as it only appears when the axis is hovered over. Instead, by adding a switch you can have this located on your filters pane and is clearer to see for your user.
Imagine you were looking at quarterly sales but then another user might want to see monthly sales and another is more interested in weekly sales. Dashboard space is often limited and it would be unwise to put each of these charts onto one dashboard. By introducing parameter date filters you can provide interactivity to the chart and save space too.
What is a parameter?
A parameter is a dynamic input that allows users to change values, such as filters, calculations, or reference lines, in visualizations without altering the underlying data or creating new calculated fields.
How to build a parameter date switch:
- Step 1: Create a Parameter
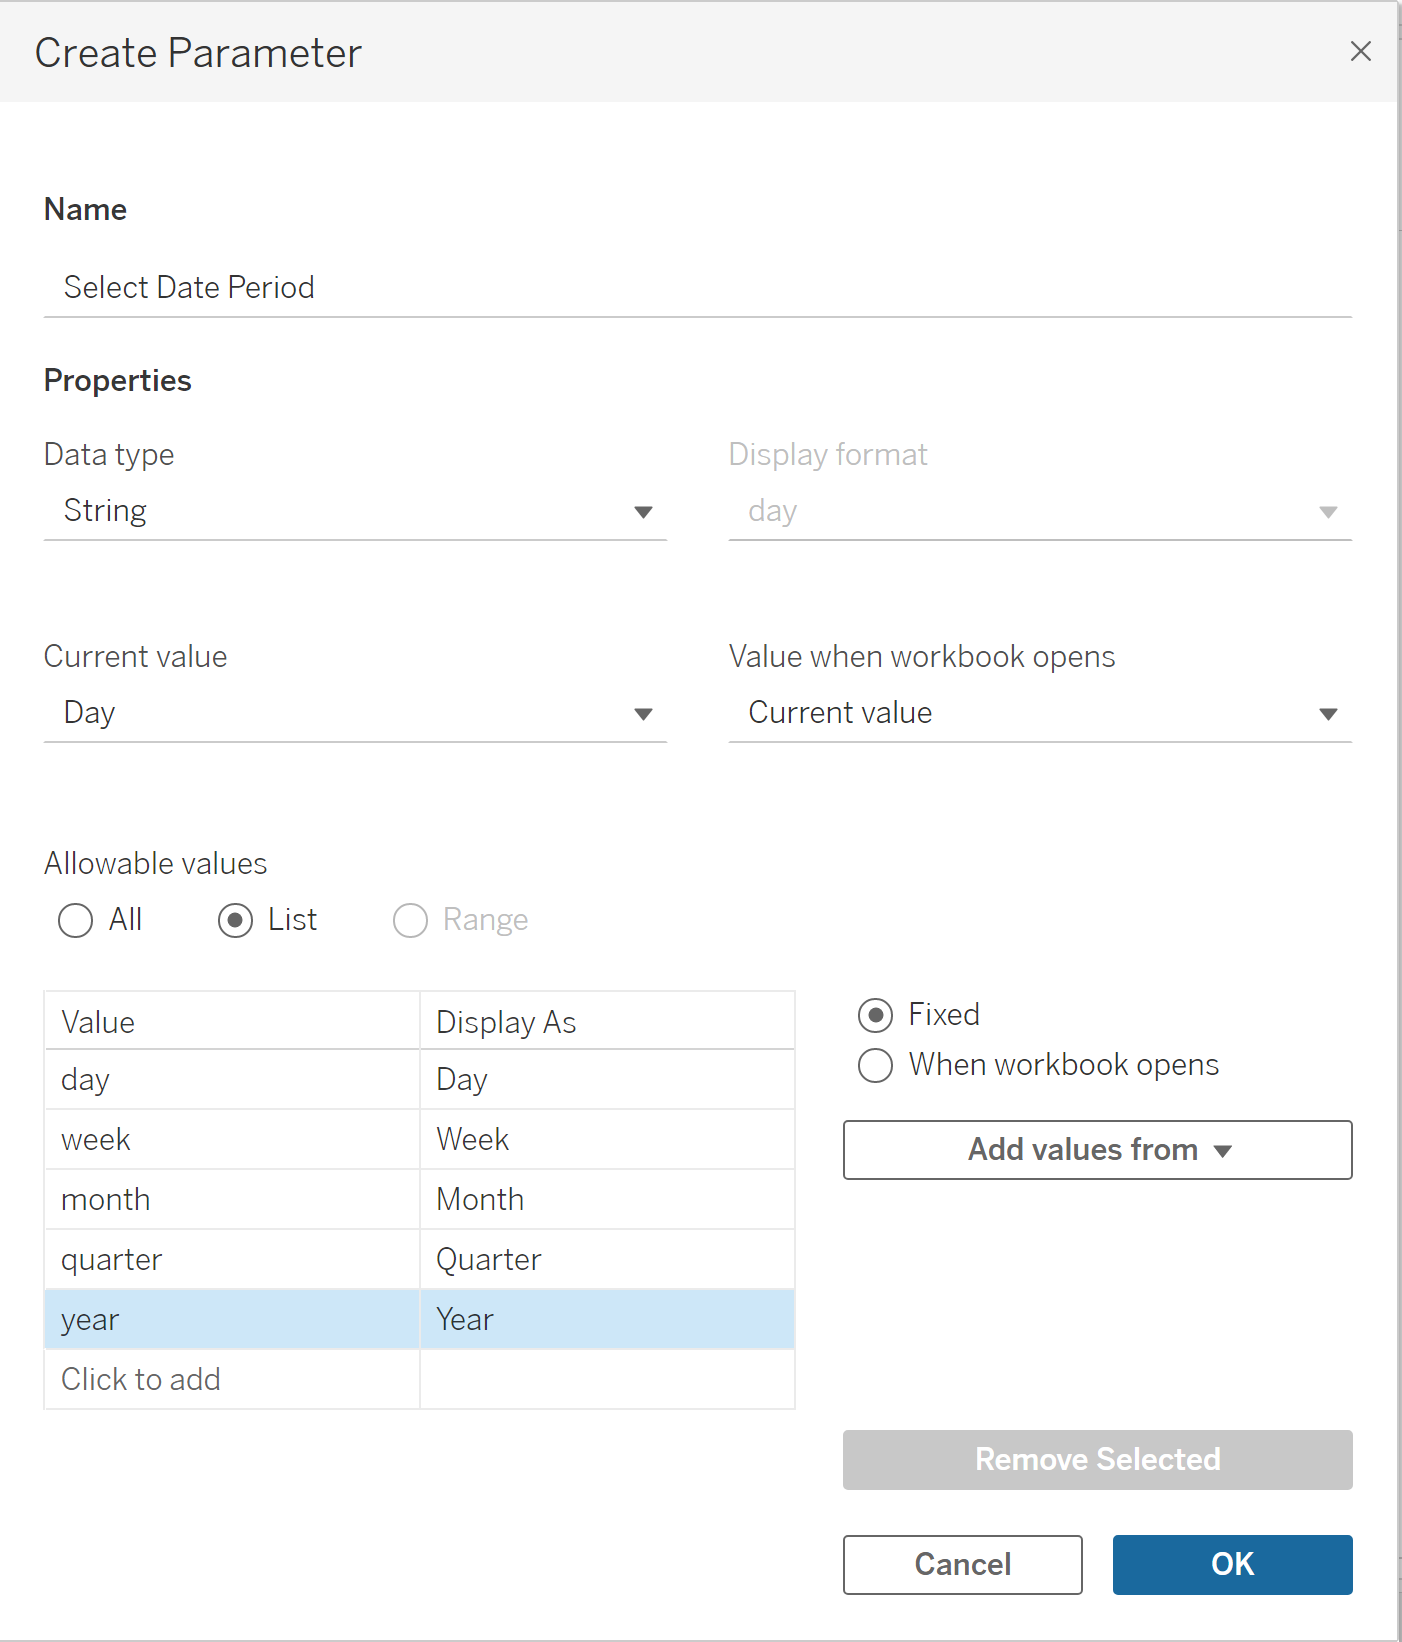
Begin by creating a parameter in Tableau. You can find this by right clicking on the date pane (left side of the screen) - Name Your Parameter
Give your parameter a meaningful name. This name will help you identify and reference it in your Tableau workbook. - Select Data Type - String
Choose "String" as the data type for your parameter. This selection is crucial as it defines what kind of values your parameter can hold. - Select Allowable Values: List
To restrict the values your parameter can take, select "Allowable values" and choose "List." This will enable you to specify a predefined list of options. - List Your Values
In this example, let's create a parameter for selecting time intervals. List the values you want to include: "day," "week," "month," "quarter," and "year." Make sure to enter these values in lowercase (more on this later) - Optional: You can also change the display format of these values. To have them displayed with capitalized first letters (e.g., "Day" instead of "day"), adjust the "Display As" option.
- Click Apply
After listing your values and configuring the display, click the "Apply" button to save your parameter settings.
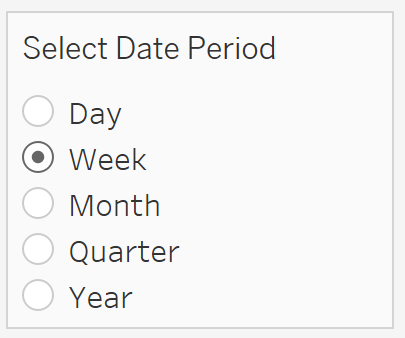
- Right-Click Your Parameter and Show Parameter
To make use of your newly created parameter, right-click it in the Parameters pane and select "Show Parameter." This will display the parameter in your Tableau worksheet, allowing users to interact with it and select from the predefined values.
Step 2: Create Your Calculated Field
In this step, we'll be creating a calculated field in Tableau that utilizes the DATETRUNC function. This function allows you to adjust the granularity of date values in your visualizations.
- Name Your Calculated Field
Give your calculated field a descriptive name. In this example, we'll name it "Select Date" or "View Date" to indicate its purpose. - Use the DATETRUNC Function
We'll use the DATETRUNC function in our calculated field. This function is used to truncate date values based on a specified level of granularity. To use it, drag and drop your parameter (created in the previous step) and your date field into the DATETRUNC function.
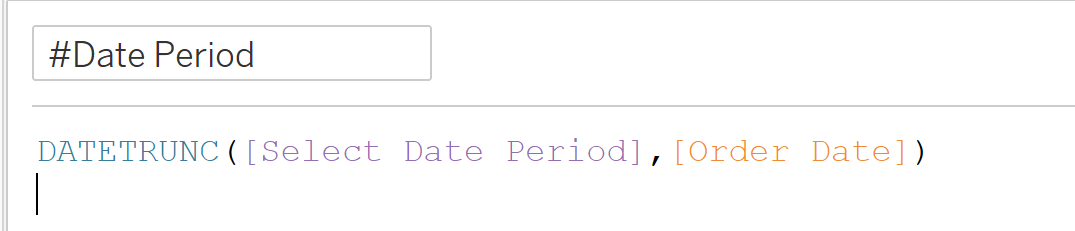
Why Use DATETRUNC:
The DATETRUNC function is useful when you want to aggregate or view date-based data at a different level of granularity. For example, if you have a date field with daily data but want to create a visualization that shows weekly or monthly trends, you can use DATETRUNC to achieve this.
Importance of Lowercase Values in the Parameter:
In your parameter, it's crucial to use lowercase values (e.g., "day," "week," "month") to ensure compatibility with the DATETRUNC function. Tableau's DATETRUNC function is case-sensitive, and specifying date parts in lowercase aligns with the function's requirements. Using uppercase values may not work as expected.
By following these steps, you can create a calculated field in Tableau that leverages the DATETRUNC function, allowing you to adjust the granularity of date values based on the selections made with your parameter.
Step 3: Create Your View
In this step, you'll create a view in Tableau by configuring your calculated field, allowing dynamic switching between date types.
- Drag Your Calculated Field to Column
Start by dragging your calculated field (e.g., "Select Date" or "View Date") to the "Columns" shelf in your Tableau worksheet. - Change to Exact Date
To enable the parameter to apply to the calculated field, right-click on the calculated field in the "Columns" shelf and select "Exact Date." This ensures that the parameter can adjust the date granularity as intended. - Drag in Your Measure (e.g., Sales)
Next, drag your measure, such as "Sales," to the "Rows" or "Label" shelf to create the visual representation of your data.
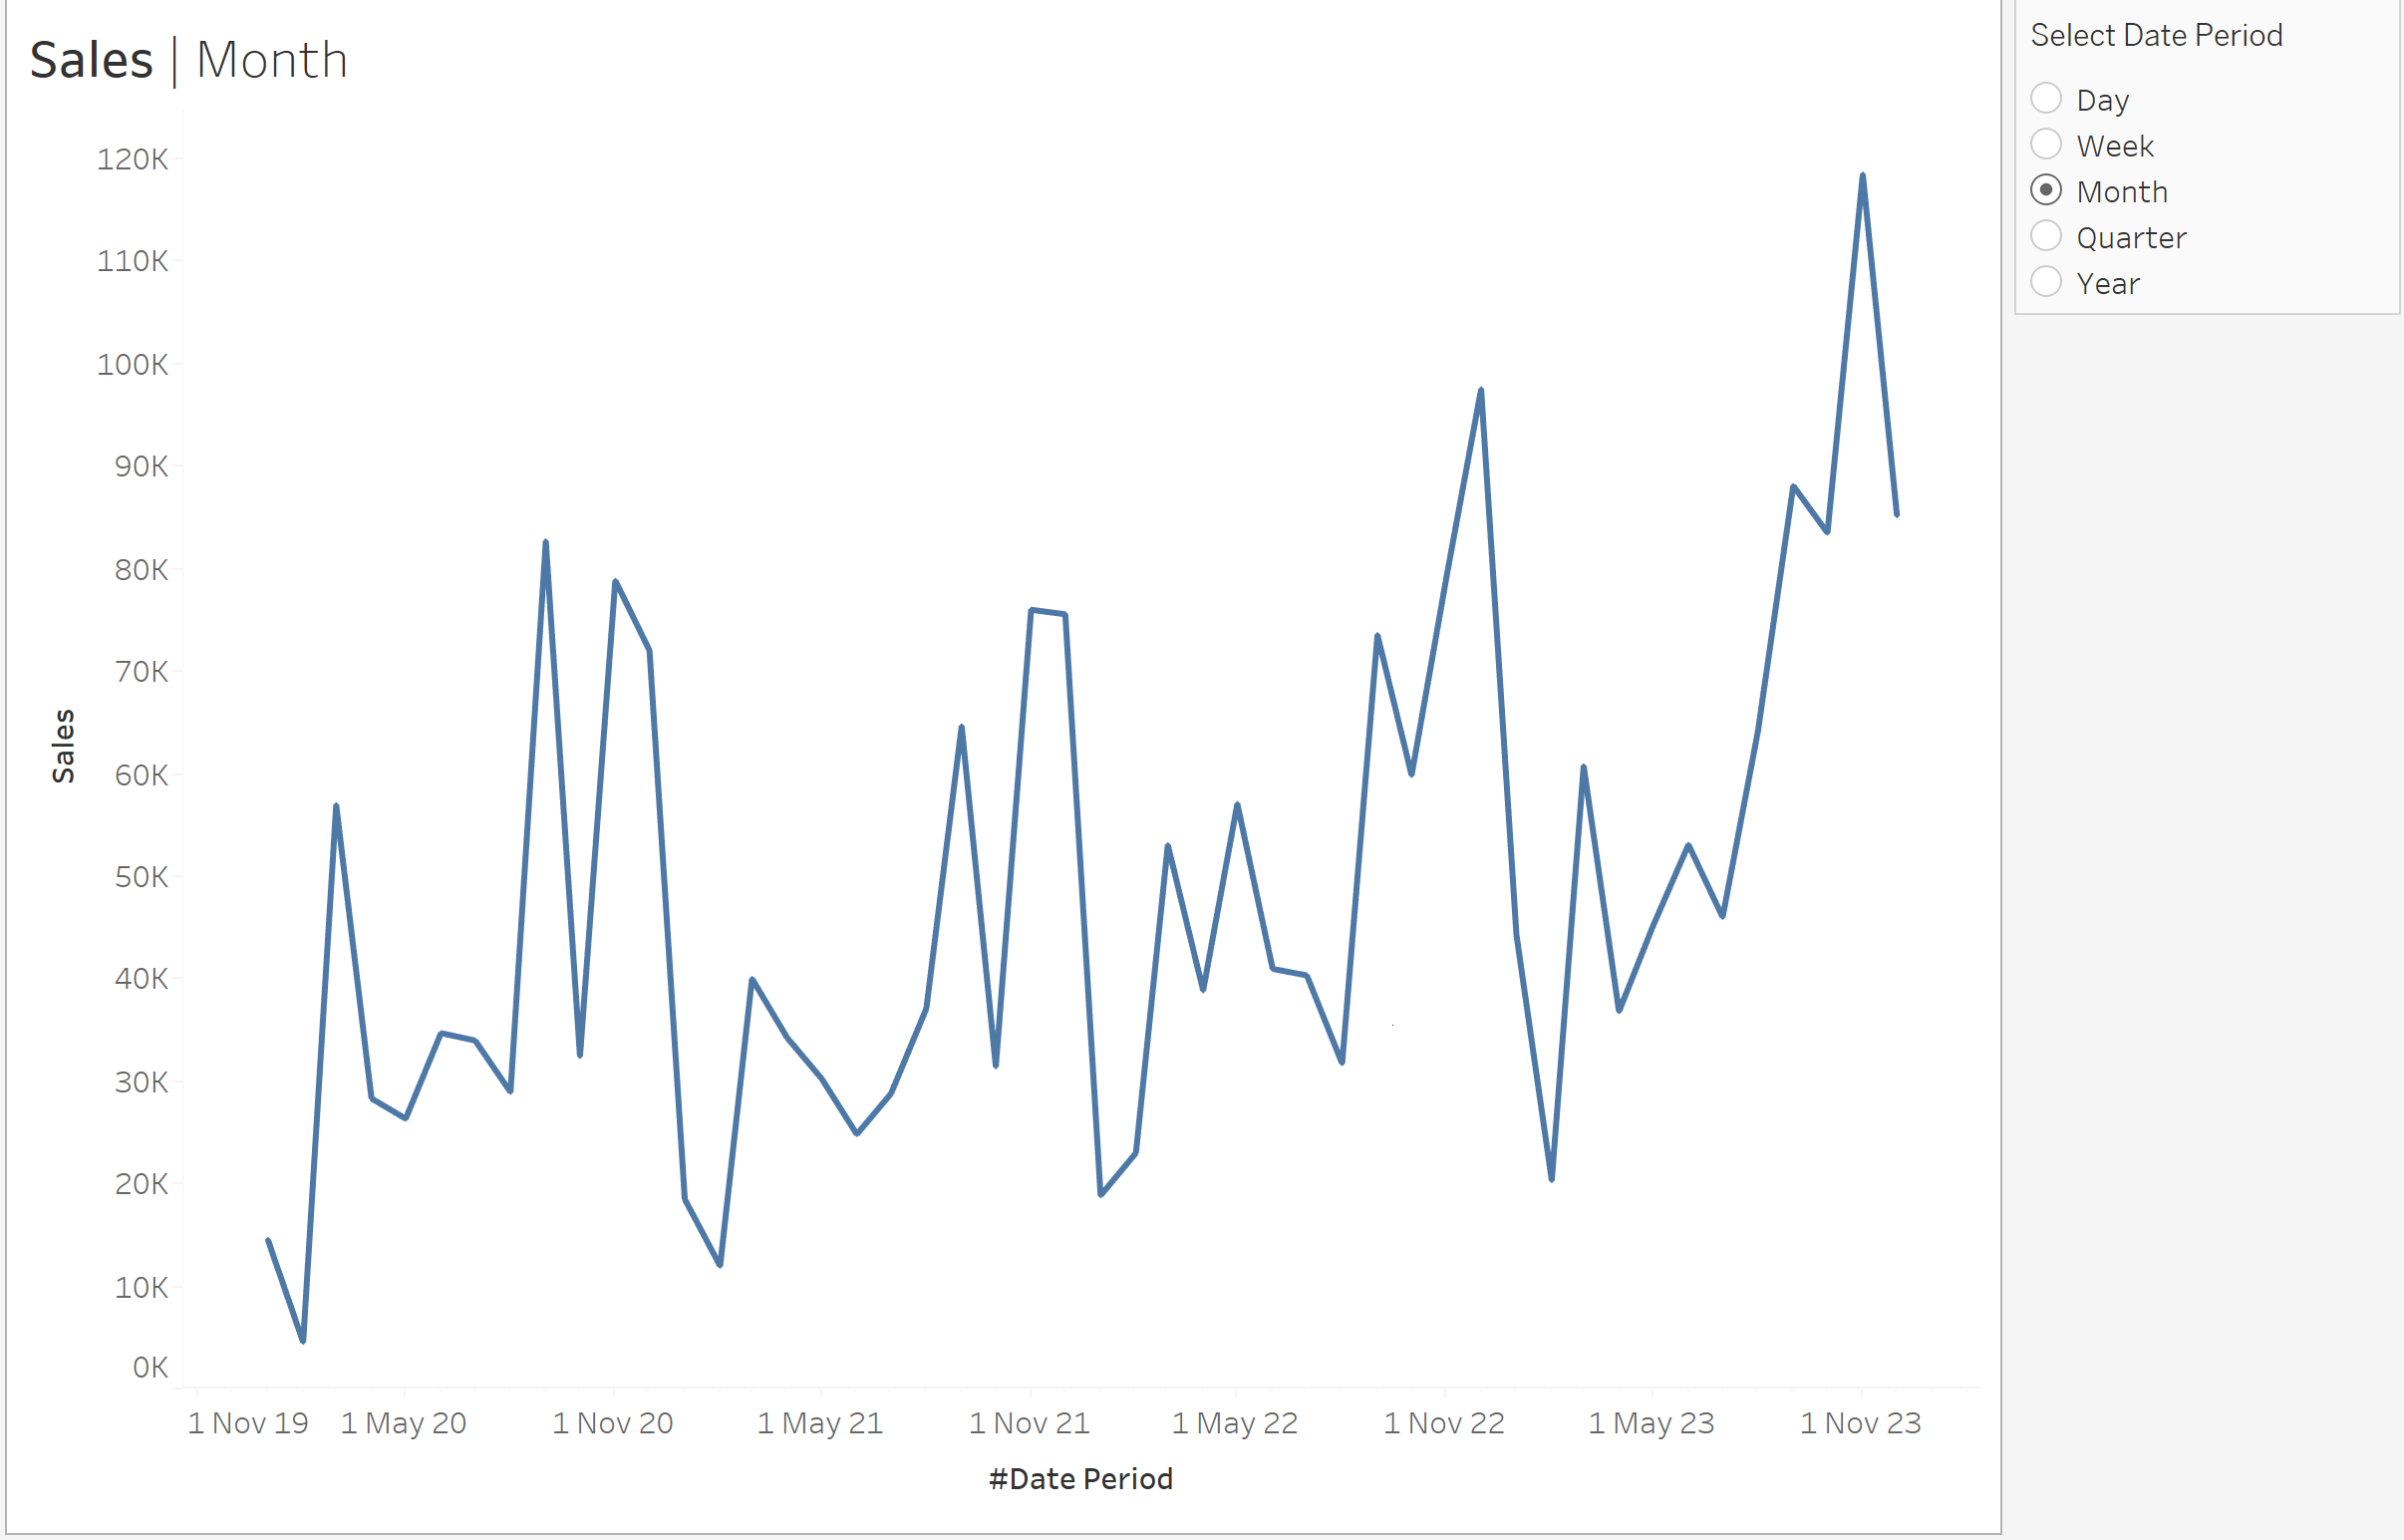
With this setup, you can now dynamically switch between different date types using your parameter.
Bonus Step: Create a Dynamic Title
In this step, you'll create a dynamic title that adjusts based on the chart type and any additional context.
- Right-Click on Title and Edit Title
Right-click on the title of your visualization, and select "Edit Title" to modify it. - Insert Your Parameter and Additional Context
Within the title editing dialog, insert your parameter (e.g., "Select Date" or "View Date") by selecting it from the available parameters. You can also include any additional context that you want to appear in the title. For example, you can add "Sales" as context.
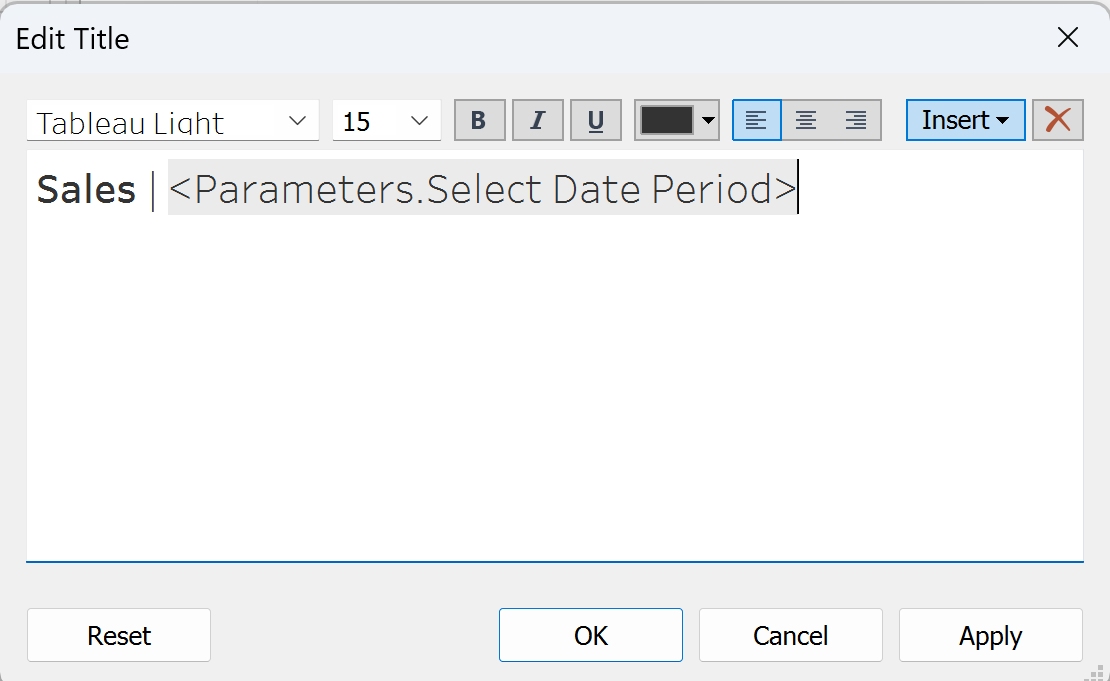
Now, your title will automatically change to reflect the selected date type and the measure (e.g., "Sales"), providing dynamic and context-aware titles for your Tableau charts as you switch between different date types.
Congratulations, you've now built a parameter date switch and dynamic title.